Stock To Pick
Below are the list of stocks can be watched for today's breakout or breakdown strategy. Entry to stock or option can be made based on confirmation of breakout or breakdown prices. The coloured signals can be looked in each stock section to identify the strategy along with technical-analysis.
What is a BreakOut?
A breakout in stocks is when a stock rises above the resistance or breakout level from the consolidation area of its recent trading range.
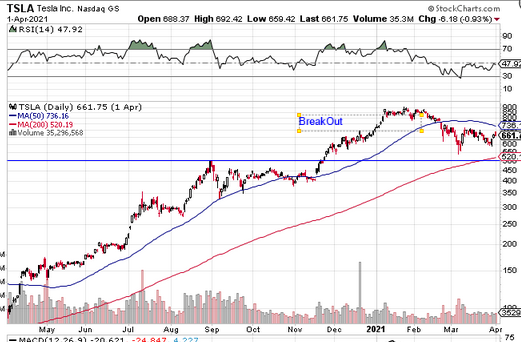
For example, as mentioned in above picture TESLA Inc(TSLA) stock has been trading in the range of $350-$520 for the past couple of months. $350 price range would have made a strong support level, whereas $520 is the resistance where it can have breakout from that price. After the stock price rallies above $520 with increased volume, it is considered a breakout stock.
What is a BreakDown?
A breakdown in stocks is when a stock drops below the resistance or support level from the consolidation area of its recent trading range.
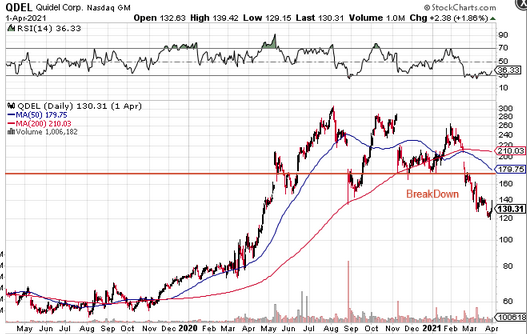
For example, as mentioned in above picture Quidel Corp(QDEL) stock has been trading in the range for $179-$280 for the past couple of months. $280 price range would have been resistance level, whereas $179 price range would be support level and price dropping from the support level would create breakdown trade for trader to short the stocks. After the stock price drops below $179 with increased sell off, it is considered a breakdown stocks.
How to trade a BreakOut/BreakDown stocks?
In-order to trade a breakout/breakdown stocks, the initial steps would be identifying the stocks which can be expected to breakout or breakdown. This site provides an ability to run through 1000+ of stocks on daily basis and identifies a stock which can enter into support or resistance level for near breakout/breakdown can happen in weeks to months time line.
The website runs through algorithm of identifying ascending/descending triangle patterns and based on the pattern it identifies the target price where it can reach. When trading breakouts/breakdown, it is important to consider the underlying stock's support and resistance levels. The more times a stock price has touched these areas, the more valid these levels are and the more important they become. At the same time, the longer these support and resistance levels have been in play, the better the outcome when the stock price finally breaks out.
Entry Point
After finding a good instrument to trade, it is time to plan the trade. The easiest consideration is the entry point. Entry points are fairly black and white when it comes to establishing positions on a breakout. Once prices are set to close above a resistance level, an investor will establish a bullish position. When prices are set to close below a support level, an investor will take on a bearish position. To determine the difference between a breakout and a fakeout, wait for confirmation. For example, fake-outs occur when prices open beyond a support or resistance level, but by the end of the day, they wind up moving back within a prior trading range. If an investor acts too quickly or without confirmation, there is no guarantee that prices will continue into new territory. Many investors look for above-average volume as confirmation or wait toward the close of a trading period to determine whether prices will sustain the levels they've broken out of.Exit Point
When planning target prices, look at the stock's recent behaviour to determine a reasonable objective. When trading price patterns, it is easy to use the recent price action to establish a price target. It is important to know when a trade has failed. Breakout trading offers this insight in a fairly clear manner. After a breakout, old resistance levels should act as new support and old support levels should act as new resistance. This is an important consideration because it is an objective way to determine when a trade has failed and an easy way to determine where to set your stop-loss order. After a position has been taken, use the old support or resistance level as a line in the sand to close out a losing trade.Leading Stocks
Warning: DOMDocument::loadHTML(): Unexpected end tag : i in Entity, line: 237 in /home/u552734802/domains/dailystocktopick.com/public_html/index.php on line 141
Warning: DOMDocument::loadHTML(): Unexpected end tag : span in Entity, line: 237 in /home/u552734802/domains/dailystocktopick.com/public_html/index.php on line 141
Warning: DOMDocument::loadHTML(): Unexpected end tag : div in Entity, line: 237 in /home/u552734802/domains/dailystocktopick.com/public_html/index.php on line 141
Warning: DOMDocument::loadHTML(): Unexpected end tag : div in Entity, line: 237 in /home/u552734802/domains/dailystocktopick.com/public_html/index.php on line 141
Warning: DOMDocument::loadHTML(): Unexpected end tag : a in Entity, line: 237 in /home/u552734802/domains/dailystocktopick.com/public_html/index.php on line 141
Warning: DOMDocument::loadHTML(): Unexpected end tag : a in Entity, line: 237 in /home/u552734802/domains/dailystocktopick.com/public_html/index.php on line 141
Warning: DOMDocument::loadHTML(): Unexpected end tag : a in Entity, line: 237 in /home/u552734802/domains/dailystocktopick.com/public_html/index.php on line 141
Warning: DOMDocument::loadHTML(): Unexpected end tag : a in Entity, line: 237 in /home/u552734802/domains/dailystocktopick.com/public_html/index.php on line 141
Warning: DOMDocument::loadHTML(): Unexpected end tag : a in Entity, line: 237 in /home/u552734802/domains/dailystocktopick.com/public_html/index.php on line 141
Warning: DOMDocument::loadHTML(): Unexpected end tag : a in Entity, line: 237 in /home/u552734802/domains/dailystocktopick.com/public_html/index.php on line 141
Warning: DOMDocument::loadHTML(): Unexpected end tag : a in Entity, line: 237 in /home/u552734802/domains/dailystocktopick.com/public_html/index.php on line 141
Warning: DOMDocument::loadHTML(): Unexpected end tag : a in Entity, line: 237 in /home/u552734802/domains/dailystocktopick.com/public_html/index.php on line 141
Warning: DOMDocument::loadHTML(): Unexpected end tag : a in Entity, line: 237 in /home/u552734802/domains/dailystocktopick.com/public_html/index.php on line 141
Warning: DOMDocument::loadHTML(): Unexpected end tag : a in Entity, line: 237 in /home/u552734802/domains/dailystocktopick.com/public_html/index.php on line 141
Warning: DOMDocument::loadHTML(): Unexpected end tag : a in Entity, line: 237 in /home/u552734802/domains/dailystocktopick.com/public_html/index.php on line 141
Warning: DOMDocument::loadHTML(): Unexpected end tag : div in Entity, line: 237 in /home/u552734802/domains/dailystocktopick.com/public_html/index.php on line 141
Warning: DOMDocument::loadHTML(): Unexpected end tag : li in Entity, line: 237 in /home/u552734802/domains/dailystocktopick.com/public_html/index.php on line 141
Warning: DOMDocument::loadHTML(): Unexpected end tag : div in Entity, line: 237 in /home/u552734802/domains/dailystocktopick.com/public_html/index.php on line 141
Warning: DOMDocument::loadHTML(): Unexpected end tag : a in Entity, line: 237 in /home/u552734802/domains/dailystocktopick.com/public_html/index.php on line 141
Warning: DOMDocument::loadHTML(): Unexpected end tag : a in Entity, line: 237 in /home/u552734802/domains/dailystocktopick.com/public_html/index.php on line 141
Warning: DOMDocument::loadHTML(): Unexpected end tag : a in Entity, line: 237 in /home/u552734802/domains/dailystocktopick.com/public_html/index.php on line 141
Warning: DOMDocument::loadHTML(): Unexpected end tag : a in Entity, line: 237 in /home/u552734802/domains/dailystocktopick.com/public_html/index.php on line 141
Warning: DOMDocument::loadHTML(): Unexpected end tag : a in Entity, line: 237 in /home/u552734802/domains/dailystocktopick.com/public_html/index.php on line 141
Warning: DOMDocument::loadHTML(): Unexpected end tag : a in Entity, line: 237 in /home/u552734802/domains/dailystocktopick.com/public_html/index.php on line 141
Warning: DOMDocument::loadHTML(): Unexpected end tag : a in Entity, line: 237 in /home/u552734802/domains/dailystocktopick.com/public_html/index.php on line 141
Warning: DOMDocument::loadHTML(): Unexpected end tag : a in Entity, line: 237 in /home/u552734802/domains/dailystocktopick.com/public_html/index.php on line 141
Warning: DOMDocument::loadHTML(): Unexpected end tag : a in Entity, line: 237 in /home/u552734802/domains/dailystocktopick.com/public_html/index.php on line 141
Warning: DOMDocument::loadHTML(): Unexpected end tag : a in Entity, line: 237 in /home/u552734802/domains/dailystocktopick.com/public_html/index.php on line 141
Warning: DOMDocument::loadHTML(): Unexpected end tag : a in Entity, line: 237 in /home/u552734802/domains/dailystocktopick.com/public_html/index.php on line 141
Warning: DOMDocument::loadHTML(): Unexpected end tag : a in Entity, line: 237 in /home/u552734802/domains/dailystocktopick.com/public_html/index.php on line 141
Warning: DOMDocument::loadHTML(): Unexpected end tag : div in Entity, line: 237 in /home/u552734802/domains/dailystocktopick.com/public_html/index.php on line 141
Warning: DOMDocument::loadHTML(): Unexpected end tag : li in Entity, line: 237 in /home/u552734802/domains/dailystocktopick.com/public_html/index.php on line 141
Warning: DOMDocument::loadHTML(): Unexpected end tag : div in Entity, line: 237 in /home/u552734802/domains/dailystocktopick.com/public_html/index.php on line 141
Warning: DOMDocument::loadHTML(): Unexpected end tag : a in Entity, line: 237 in /home/u552734802/domains/dailystocktopick.com/public_html/index.php on line 141
Warning: DOMDocument::loadHTML(): Unexpected end tag : a in Entity, line: 237 in /home/u552734802/domains/dailystocktopick.com/public_html/index.php on line 141
Warning: DOMDocument::loadHTML(): Unexpected end tag : a in Entity, line: 237 in /home/u552734802/domains/dailystocktopick.com/public_html/index.php on line 141
Warning: DOMDocument::loadHTML(): Unexpected end tag : a in Entity, line: 237 in /home/u552734802/domains/dailystocktopick.com/public_html/index.php on line 141
Warning: DOMDocument::loadHTML(): Unexpected end tag : a in Entity, line: 237 in /home/u552734802/domains/dailystocktopick.com/public_html/index.php on line 141
Warning: DOMDocument::loadHTML(): Unexpected end tag : a in Entity, line: 237 in /home/u552734802/domains/dailystocktopick.com/public_html/index.php on line 141
Warning: DOMDocument::loadHTML(): Unexpected end tag : a in Entity, line: 237 in /home/u552734802/domains/dailystocktopick.com/public_html/index.php on line 141
Warning: DOMDocument::loadHTML(): Unexpected end tag : a in Entity, line: 237 in /home/u552734802/domains/dailystocktopick.com/public_html/index.php on line 141
Warning: DOMDocument::loadHTML(): Unexpected end tag : div in Entity, line: 237 in /home/u552734802/domains/dailystocktopick.com/public_html/index.php on line 141
Warning: DOMDocument::loadHTML(): Unexpected end tag : li in Entity, line: 237 in /home/u552734802/domains/dailystocktopick.com/public_html/index.php on line 141
Warning: DOMDocument::loadHTML(): Unexpected end tag : div in Entity, line: 237 in /home/u552734802/domains/dailystocktopick.com/public_html/index.php on line 141
Warning: DOMDocument::loadHTML(): Unexpected end tag : a in Entity, line: 237 in /home/u552734802/domains/dailystocktopick.com/public_html/index.php on line 141
Warning: DOMDocument::loadHTML(): Unexpected end tag : a in Entity, line: 237 in /home/u552734802/domains/dailystocktopick.com/public_html/index.php on line 141
Warning: DOMDocument::loadHTML(): Unexpected end tag : a in Entity, line: 237 in /home/u552734802/domains/dailystocktopick.com/public_html/index.php on line 141
Warning: DOMDocument::loadHTML(): Unexpected end tag : a in Entity, line: 237 in /home/u552734802/domains/dailystocktopick.com/public_html/index.php on line 141
Warning: DOMDocument::loadHTML(): Unexpected end tag : a in Entity, line: 237 in /home/u552734802/domains/dailystocktopick.com/public_html/index.php on line 141
Warning: DOMDocument::loadHTML(): Unexpected end tag : a in Entity, line: 237 in /home/u552734802/domains/dailystocktopick.com/public_html/index.php on line 141
Warning: DOMDocument::loadHTML(): Unexpected end tag : a in Entity, line: 237 in /home/u552734802/domains/dailystocktopick.com/public_html/index.php on line 141
Warning: DOMDocument::loadHTML(): Unexpected end tag : a in Entity, line: 237 in /home/u552734802/domains/dailystocktopick.com/public_html/index.php on line 141
Warning: DOMDocument::loadHTML(): Unexpected end tag : a in Entity, line: 237 in /home/u552734802/domains/dailystocktopick.com/public_html/index.php on line 141
Warning: DOMDocument::loadHTML(): Unexpected end tag : a in Entity, line: 237 in /home/u552734802/domains/dailystocktopick.com/public_html/index.php on line 141
Warning: DOMDocument::loadHTML(): Unexpected end tag : a in Entity, line: 237 in /home/u552734802/domains/dailystocktopick.com/public_html/index.php on line 141
Warning: DOMDocument::loadHTML(): Unexpected end tag : a in Entity, line: 237 in /home/u552734802/domains/dailystocktopick.com/public_html/index.php on line 141
Warning: DOMDocument::loadHTML(): Unexpected end tag : div in Entity, line: 237 in /home/u552734802/domains/dailystocktopick.com/public_html/index.php on line 141
Warning: DOMDocument::loadHTML(): Unexpected end tag : li in Entity, line: 237 in /home/u552734802/domains/dailystocktopick.com/public_html/index.php on line 141
Warning: DOMDocument::loadHTML(): Unexpected end tag : div in Entity, line: 237 in /home/u552734802/domains/dailystocktopick.com/public_html/index.php on line 141
Warning: DOMDocument::loadHTML(): Unexpected end tag : a in Entity, line: 237 in /home/u552734802/domains/dailystocktopick.com/public_html/index.php on line 141
Warning: DOMDocument::loadHTML(): Unexpected end tag : a in Entity, line: 237 in /home/u552734802/domains/dailystocktopick.com/public_html/index.php on line 141
Warning: DOMDocument::loadHTML(): Unexpected end tag : a in Entity, line: 237 in /home/u552734802/domains/dailystocktopick.com/public_html/index.php on line 141
Warning: DOMDocument::loadHTML(): Unexpected end tag : a in Entity, line: 237 in /home/u552734802/domains/dailystocktopick.com/public_html/index.php on line 141
Warning: DOMDocument::loadHTML(): Unexpected end tag : a in Entity, line: 237 in /home/u552734802/domains/dailystocktopick.com/public_html/index.php on line 141
Warning: DOMDocument::loadHTML(): Unexpected end tag : a in Entity, line: 237 in /home/u552734802/domains/dailystocktopick.com/public_html/index.php on line 141
Warning: DOMDocument::loadHTML(): Unexpected end tag : div in Entity, line: 237 in /home/u552734802/domains/dailystocktopick.com/public_html/index.php on line 141
Warning: DOMDocument::loadHTML(): Unexpected end tag : li in Entity, line: 237 in /home/u552734802/domains/dailystocktopick.com/public_html/index.php on line 141
Warning: DOMDocument::loadHTML(): Unexpected end tag : div in Entity, line: 237 in /home/u552734802/domains/dailystocktopick.com/public_html/index.php on line 141
Warning: DOMDocument::loadHTML(): Unexpected end tag : a in Entity, line: 237 in /home/u552734802/domains/dailystocktopick.com/public_html/index.php on line 141
Warning: DOMDocument::loadHTML(): Unexpected end tag : a in Entity, line: 237 in /home/u552734802/domains/dailystocktopick.com/public_html/index.php on line 141
Warning: DOMDocument::loadHTML(): Unexpected end tag : a in Entity, line: 237 in /home/u552734802/domains/dailystocktopick.com/public_html/index.php on line 141
Warning: DOMDocument::loadHTML(): Unexpected end tag : a in Entity, line: 237 in /home/u552734802/domains/dailystocktopick.com/public_html/index.php on line 141
Warning: DOMDocument::loadHTML(): Unexpected end tag : a in Entity, line: 237 in /home/u552734802/domains/dailystocktopick.com/public_html/index.php on line 141
Warning: DOMDocument::loadHTML(): Unexpected end tag : a in Entity, line: 237 in /home/u552734802/domains/dailystocktopick.com/public_html/index.php on line 141
Warning: DOMDocument::loadHTML(): Unexpected end tag : a in Entity, line: 237 in /home/u552734802/domains/dailystocktopick.com/public_html/index.php on line 141
Warning: DOMDocument::loadHTML(): Unexpected end tag : a in Entity, line: 237 in /home/u552734802/domains/dailystocktopick.com/public_html/index.php on line 141
Warning: DOMDocument::loadHTML(): Unexpected end tag : a in Entity, line: 237 in /home/u552734802/domains/dailystocktopick.com/public_html/index.php on line 141
Warning: DOMDocument::loadHTML(): Unexpected end tag : a in Entity, line: 237 in /home/u552734802/domains/dailystocktopick.com/public_html/index.php on line 141
Warning: DOMDocument::loadHTML(): Unexpected end tag : a in Entity, line: 237 in /home/u552734802/domains/dailystocktopick.com/public_html/index.php on line 141
Warning: DOMDocument::loadHTML(): Unexpected end tag : a in Entity, line: 237 in /home/u552734802/domains/dailystocktopick.com/public_html/index.php on line 141
Warning: DOMDocument::loadHTML(): Unexpected end tag : a in Entity, line: 237 in /home/u552734802/domains/dailystocktopick.com/public_html/index.php on line 141
Warning: DOMDocument::loadHTML(): Unexpected end tag : a in Entity, line: 237 in /home/u552734802/domains/dailystocktopick.com/public_html/index.php on line 141
Warning: DOMDocument::loadHTML(): Unexpected end tag : a in Entity, line: 237 in /home/u552734802/domains/dailystocktopick.com/public_html/index.php on line 141
Warning: DOMDocument::loadHTML(): Unexpected end tag : a in Entity, line: 237 in /home/u552734802/domains/dailystocktopick.com/public_html/index.php on line 141
Warning: DOMDocument::loadHTML(): Unexpected end tag : a in Entity, line: 237 in /home/u552734802/domains/dailystocktopick.com/public_html/index.php on line 141
Warning: DOMDocument::loadHTML(): Unexpected end tag : a in Entity, line: 237 in /home/u552734802/domains/dailystocktopick.com/public_html/index.php on line 141
Warning: DOMDocument::loadHTML(): Unexpected end tag : div in Entity, line: 237 in /home/u552734802/domains/dailystocktopick.com/public_html/index.php on line 141
Warning: DOMDocument::loadHTML(): Unexpected end tag : li in Entity, line: 237 in /home/u552734802/domains/dailystocktopick.com/public_html/index.php on line 141
Warning: DOMDocument::loadHTML(): Unexpected end tag : div in Entity, line: 237 in /home/u552734802/domains/dailystocktopick.com/public_html/index.php on line 141
Warning: DOMDocument::loadHTML(): Unexpected end tag : a in Entity, line: 237 in /home/u552734802/domains/dailystocktopick.com/public_html/index.php on line 141
Warning: DOMDocument::loadHTML(): Unexpected end tag : a in Entity, line: 237 in /home/u552734802/domains/dailystocktopick.com/public_html/index.php on line 141
Warning: DOMDocument::loadHTML(): Unexpected end tag : a in Entity, line: 237 in /home/u552734802/domains/dailystocktopick.com/public_html/index.php on line 141
Warning: DOMDocument::loadHTML(): Unexpected end tag : a in Entity, line: 237 in /home/u552734802/domains/dailystocktopick.com/public_html/index.php on line 141
Warning: DOMDocument::loadHTML(): Unexpected end tag : a in Entity, line: 237 in /home/u552734802/domains/dailystocktopick.com/public_html/index.php on line 141
Warning: DOMDocument::loadHTML(): Unexpected end tag : a in Entity, line: 237 in /home/u552734802/domains/dailystocktopick.com/public_html/index.php on line 141
Warning: DOMDocument::loadHTML(): Unexpected end tag : a in Entity, line: 237 in /home/u552734802/domains/dailystocktopick.com/public_html/index.php on line 141
Warning: DOMDocument::loadHTML(): Unexpected end tag : a in Entity, line: 237 in /home/u552734802/domains/dailystocktopick.com/public_html/index.php on line 141
Warning: DOMDocument::loadHTML(): Unexpected end tag : a in Entity, line: 237 in /home/u552734802/domains/dailystocktopick.com/public_html/index.php on line 141
Warning: DOMDocument::loadHTML(): Unexpected end tag : a in Entity, line: 237 in /home/u552734802/domains/dailystocktopick.com/public_html/index.php on line 141
Warning: DOMDocument::loadHTML(): Unexpected end tag : a in Entity, line: 237 in /home/u552734802/domains/dailystocktopick.com/public_html/index.php on line 141
Warning: DOMDocument::loadHTML(): Unexpected end tag : a in Entity, line: 237 in /home/u552734802/domains/dailystocktopick.com/public_html/index.php on line 141
Warning: DOMDocument::loadHTML(): Unexpected end tag : a in Entity, line: 237 in /home/u552734802/domains/dailystocktopick.com/public_html/index.php on line 141
Warning: DOMDocument::loadHTML(): Unexpected end tag : a in Entity, line: 237 in /home/u552734802/domains/dailystocktopick.com/public_html/index.php on line 141
Warning: DOMDocument::loadHTML(): Unexpected end tag : a in Entity, line: 237 in /home/u552734802/domains/dailystocktopick.com/public_html/index.php on line 141
Warning: DOMDocument::loadHTML(): Unexpected end tag : div in Entity, line: 237 in /home/u552734802/domains/dailystocktopick.com/public_html/index.php on line 141
Warning: DOMDocument::loadHTML(): Unexpected end tag : li in Entity, line: 237 in /home/u552734802/domains/dailystocktopick.com/public_html/index.php on line 141
Warning: DOMDocument::loadHTML(): Unexpected end tag : div in Entity, line: 237 in /home/u552734802/domains/dailystocktopick.com/public_html/index.php on line 141
Warning: DOMDocument::loadHTML(): Unexpected end tag : a in Entity, line: 237 in /home/u552734802/domains/dailystocktopick.com/public_html/index.php on line 141
Warning: DOMDocument::loadHTML(): Unexpected end tag : a in Entity, line: 237 in /home/u552734802/domains/dailystocktopick.com/public_html/index.php on line 141
Warning: DOMDocument::loadHTML(): Unexpected end tag : a in Entity, line: 237 in /home/u552734802/domains/dailystocktopick.com/public_html/index.php on line 141
Warning: DOMDocument::loadHTML(): Unexpected end tag : a in Entity, line: 237 in /home/u552734802/domains/dailystocktopick.com/public_html/index.php on line 141
Warning: DOMDocument::loadHTML(): Unexpected end tag : a in Entity, line: 237 in /home/u552734802/domains/dailystocktopick.com/public_html/index.php on line 141
Warning: DOMDocument::loadHTML(): Unexpected end tag : a in Entity, line: 237 in /home/u552734802/domains/dailystocktopick.com/public_html/index.php on line 141
Warning: DOMDocument::loadHTML(): Unexpected end tag : a in Entity, line: 237 in /home/u552734802/domains/dailystocktopick.com/public_html/index.php on line 141
Warning: DOMDocument::loadHTML(): Unexpected end tag : a in Entity, line: 237 in /home/u552734802/domains/dailystocktopick.com/public_html/index.php on line 141
Warning: DOMDocument::loadHTML(): Unexpected end tag : a in Entity, line: 237 in /home/u552734802/domains/dailystocktopick.com/public_html/index.php on line 141
Warning: DOMDocument::loadHTML(): Unexpected end tag : a in Entity, line: 237 in /home/u552734802/domains/dailystocktopick.com/public_html/index.php on line 141
Warning: DOMDocument::loadHTML(): Unexpected end tag : a in Entity, line: 237 in /home/u552734802/domains/dailystocktopick.com/public_html/index.php on line 141
Warning: DOMDocument::loadHTML(): Unexpected end tag : a in Entity, line: 237 in /home/u552734802/domains/dailystocktopick.com/public_html/index.php on line 141
Warning: DOMDocument::loadHTML(): Unexpected end tag : a in Entity, line: 237 in /home/u552734802/domains/dailystocktopick.com/public_html/index.php on line 141
Warning: DOMDocument::loadHTML(): Unexpected end tag : div in Entity, line: 237 in /home/u552734802/domains/dailystocktopick.com/public_html/index.php on line 141
Warning: DOMDocument::loadHTML(): Unexpected end tag : li in Entity, line: 237 in /home/u552734802/domains/dailystocktopick.com/public_html/index.php on line 141
Warning: DOMDocument::loadHTML(): Unexpected end tag : div in Entity, line: 237 in /home/u552734802/domains/dailystocktopick.com/public_html/index.php on line 141
Warning: DOMDocument::loadHTML(): Unexpected end tag : a in Entity, line: 237 in /home/u552734802/domains/dailystocktopick.com/public_html/index.php on line 141
Warning: DOMDocument::loadHTML(): Unexpected end tag : a in Entity, line: 237 in /home/u552734802/domains/dailystocktopick.com/public_html/index.php on line 141
Warning: DOMDocument::loadHTML(): Unexpected end tag : a in Entity, line: 237 in /home/u552734802/domains/dailystocktopick.com/public_html/index.php on line 141
Warning: DOMDocument::loadHTML(): Unexpected end tag : a in Entity, line: 237 in /home/u552734802/domains/dailystocktopick.com/public_html/index.php on line 141
Warning: DOMDocument::loadHTML(): Unexpected end tag : a in Entity, line: 237 in /home/u552734802/domains/dailystocktopick.com/public_html/index.php on line 141
Warning: DOMDocument::loadHTML(): Unexpected end tag : a in Entity, line: 237 in /home/u552734802/domains/dailystocktopick.com/public_html/index.php on line 141
Warning: DOMDocument::loadHTML(): Unexpected end tag : a in Entity, line: 237 in /home/u552734802/domains/dailystocktopick.com/public_html/index.php on line 141
Warning: DOMDocument::loadHTML(): Unexpected end tag : a in Entity, line: 237 in /home/u552734802/domains/dailystocktopick.com/public_html/index.php on line 141
Warning: DOMDocument::loadHTML(): Unexpected end tag : a in Entity, line: 237 in /home/u552734802/domains/dailystocktopick.com/public_html/index.php on line 141
Warning: DOMDocument::loadHTML(): Unexpected end tag : a in Entity, line: 237 in /home/u552734802/domains/dailystocktopick.com/public_html/index.php on line 141
Warning: DOMDocument::loadHTML(): Unexpected end tag : a in Entity, line: 237 in /home/u552734802/domains/dailystocktopick.com/public_html/index.php on line 141
Warning: DOMDocument::loadHTML(): Unexpected end tag : a in Entity, line: 237 in /home/u552734802/domains/dailystocktopick.com/public_html/index.php on line 141
Warning: DOMDocument::loadHTML(): Unexpected end tag : a in Entity, line: 237 in /home/u552734802/domains/dailystocktopick.com/public_html/index.php on line 141
Warning: DOMDocument::loadHTML(): Unexpected end tag : a in Entity, line: 237 in /home/u552734802/domains/dailystocktopick.com/public_html/index.php on line 141
Warning: DOMDocument::loadHTML(): Unexpected end tag : a in Entity, line: 237 in /home/u552734802/domains/dailystocktopick.com/public_html/index.php on line 141
Warning: DOMDocument::loadHTML(): Unexpected end tag : a in Entity, line: 237 in /home/u552734802/domains/dailystocktopick.com/public_html/index.php on line 141
Warning: DOMDocument::loadHTML(): Unexpected end tag : div in Entity, line: 237 in /home/u552734802/domains/dailystocktopick.com/public_html/index.php on line 141
Warning: DOMDocument::loadHTML(): Unexpected end tag : li in Entity, line: 237 in /home/u552734802/domains/dailystocktopick.com/public_html/index.php on line 141
Warning: DOMDocument::loadHTML(): Unexpected end tag : div in Entity, line: 237 in /home/u552734802/domains/dailystocktopick.com/public_html/index.php on line 141
Warning: DOMDocument::loadHTML(): Unexpected end tag : a in Entity, line: 237 in /home/u552734802/domains/dailystocktopick.com/public_html/index.php on line 141
Warning: DOMDocument::loadHTML(): Unexpected end tag : a in Entity, line: 237 in /home/u552734802/domains/dailystocktopick.com/public_html/index.php on line 141
Warning: DOMDocument::loadHTML(): Unexpected end tag : a in Entity, line: 237 in /home/u552734802/domains/dailystocktopick.com/public_html/index.php on line 141
Warning: DOMDocument::loadHTML(): Unexpected end tag : a in Entity, line: 237 in /home/u552734802/domains/dailystocktopick.com/public_html/index.php on line 141
Warning: DOMDocument::loadHTML(): Unexpected end tag : a in Entity, line: 237 in /home/u552734802/domains/dailystocktopick.com/public_html/index.php on line 141
Warning: DOMDocument::loadHTML(): Unexpected end tag : a in Entity, line: 237 in /home/u552734802/domains/dailystocktopick.com/public_html/index.php on line 141
Warning: DOMDocument::loadHTML(): Unexpected end tag : a in Entity, line: 237 in /home/u552734802/domains/dailystocktopick.com/public_html/index.php on line 141
Warning: DOMDocument::loadHTML(): Unexpected end tag : a in Entity, line: 237 in /home/u552734802/domains/dailystocktopick.com/public_html/index.php on line 141
Warning: DOMDocument::loadHTML(): Unexpected end tag : a in Entity, line: 237 in /home/u552734802/domains/dailystocktopick.com/public_html/index.php on line 141
Warning: DOMDocument::loadHTML(): Unexpected end tag : a in Entity, line: 237 in /home/u552734802/domains/dailystocktopick.com/public_html/index.php on line 141
Warning: DOMDocument::loadHTML(): Unexpected end tag : a in Entity, line: 237 in /home/u552734802/domains/dailystocktopick.com/public_html/index.php on line 141
Warning: DOMDocument::loadHTML(): Unexpected end tag : a in Entity, line: 237 in /home/u552734802/domains/dailystocktopick.com/public_html/index.php on line 141
Warning: DOMDocument::loadHTML(): Unexpected end tag : a in Entity, line: 237 in /home/u552734802/domains/dailystocktopick.com/public_html/index.php on line 141
Warning: DOMDocument::loadHTML(): Unexpected end tag : a in Entity, line: 237 in /home/u552734802/domains/dailystocktopick.com/public_html/index.php on line 141
Warning: DOMDocument::loadHTML(): Unexpected end tag : a in Entity, line: 237 in /home/u552734802/domains/dailystocktopick.com/public_html/index.php on line 141
Warning: DOMDocument::loadHTML(): Unexpected end tag : a in Entity, line: 237 in /home/u552734802/domains/dailystocktopick.com/public_html/index.php on line 141
Warning: DOMDocument::loadHTML(): Unexpected end tag : a in Entity, line: 237 in /home/u552734802/domains/dailystocktopick.com/public_html/index.php on line 141
Warning: DOMDocument::loadHTML(): Unexpected end tag : a in Entity, line: 237 in /home/u552734802/domains/dailystocktopick.com/public_html/index.php on line 141
Warning: DOMDocument::loadHTML(): Unexpected end tag : div in Entity, line: 237 in /home/u552734802/domains/dailystocktopick.com/public_html/index.php on line 141
Warning: DOMDocument::loadHTML(): Unexpected end tag : li in Entity, line: 237 in /home/u552734802/domains/dailystocktopick.com/public_html/index.php on line 141
Warning: DOMDocument::loadHTML(): Unexpected end tag : div in Entity, line: 237 in /home/u552734802/domains/dailystocktopick.com/public_html/index.php on line 141
Warning: DOMDocument::loadHTML(): Unexpected end tag : a in Entity, line: 237 in /home/u552734802/domains/dailystocktopick.com/public_html/index.php on line 141
Warning: DOMDocument::loadHTML(): Unexpected end tag : a in Entity, line: 237 in /home/u552734802/domains/dailystocktopick.com/public_html/index.php on line 141
Warning: DOMDocument::loadHTML(): Unexpected end tag : a in Entity, line: 237 in /home/u552734802/domains/dailystocktopick.com/public_html/index.php on line 141
Warning: DOMDocument::loadHTML(): Unexpected end tag : a in Entity, line: 237 in /home/u552734802/domains/dailystocktopick.com/public_html/index.php on line 141
Warning: DOMDocument::loadHTML(): Unexpected end tag : a in Entity, line: 237 in /home/u552734802/domains/dailystocktopick.com/public_html/index.php on line 141
Warning: DOMDocument::loadHTML(): Unexpected end tag : a in Entity, line: 237 in /home/u552734802/domains/dailystocktopick.com/public_html/index.php on line 141
Warning: DOMDocument::loadHTML(): Unexpected end tag : a in Entity, line: 237 in /home/u552734802/domains/dailystocktopick.com/public_html/index.php on line 141
Warning: DOMDocument::loadHTML(): Unexpected end tag : a in Entity, line: 237 in /home/u552734802/domains/dailystocktopick.com/public_html/index.php on line 141
Warning: DOMDocument::loadHTML(): Unexpected end tag : a in Entity, line: 237 in /home/u552734802/domains/dailystocktopick.com/public_html/index.php on line 141
Warning: DOMDocument::loadHTML(): Unexpected end tag : a in Entity, line: 237 in /home/u552734802/domains/dailystocktopick.com/public_html/index.php on line 141
Warning: DOMDocument::loadHTML(): Unexpected end tag : div in Entity, line: 237 in /home/u552734802/domains/dailystocktopick.com/public_html/index.php on line 141
Warning: DOMDocument::loadHTML(): Unexpected end tag : li in Entity, line: 237 in /home/u552734802/domains/dailystocktopick.com/public_html/index.php on line 141
Warning: DOMDocument::loadHTML(): Unexpected end tag : div in Entity, line: 237 in /home/u552734802/domains/dailystocktopick.com/public_html/index.php on line 141
Warning: DOMDocument::loadHTML(): Unexpected end tag : a in Entity, line: 237 in /home/u552734802/domains/dailystocktopick.com/public_html/index.php on line 141
Warning: DOMDocument::loadHTML(): Unexpected end tag : a in Entity, line: 237 in /home/u552734802/domains/dailystocktopick.com/public_html/index.php on line 141
Warning: DOMDocument::loadHTML(): Unexpected end tag : a in Entity, line: 237 in /home/u552734802/domains/dailystocktopick.com/public_html/index.php on line 141
Warning: DOMDocument::loadHTML(): Unexpected end tag : a in Entity, line: 237 in /home/u552734802/domains/dailystocktopick.com/public_html/index.php on line 141
Warning: DOMDocument::loadHTML(): Unexpected end tag : a in Entity, line: 237 in /home/u552734802/domains/dailystocktopick.com/public_html/index.php on line 141
Warning: DOMDocument::loadHTML(): Unexpected end tag : a in Entity, line: 237 in /home/u552734802/domains/dailystocktopick.com/public_html/index.php on line 141
Warning: DOMDocument::loadHTML(): Unexpected end tag : a in Entity, line: 237 in /home/u552734802/domains/dailystocktopick.com/public_html/index.php on line 141
Warning: DOMDocument::loadHTML(): Unexpected end tag : a in Entity, line: 237 in /home/u552734802/domains/dailystocktopick.com/public_html/index.php on line 141
Warning: DOMDocument::loadHTML(): Unexpected end tag : a in Entity, line: 237 in /home/u552734802/domains/dailystocktopick.com/public_html/index.php on line 141
Warning: DOMDocument::loadHTML(): Unexpected end tag : a in Entity, line: 237 in /home/u552734802/domains/dailystocktopick.com/public_html/index.php on line 141
Warning: DOMDocument::loadHTML(): Unexpected end tag : a in Entity, line: 237 in /home/u552734802/domains/dailystocktopick.com/public_html/index.php on line 141
Warning: DOMDocument::loadHTML(): Unexpected end tag : div in Entity, line: 237 in /home/u552734802/domains/dailystocktopick.com/public_html/index.php on line 141
Warning: DOMDocument::loadHTML(): Unexpected end tag : li in Entity, line: 237 in /home/u552734802/domains/dailystocktopick.com/public_html/index.php on line 141
Warning: DOMDocument::loadHTML(): Unexpected end tag : div in Entity, line: 237 in /home/u552734802/domains/dailystocktopick.com/public_html/index.php on line 141
Warning: DOMDocument::loadHTML(): Unexpected end tag : a in Entity, line: 237 in /home/u552734802/domains/dailystocktopick.com/public_html/index.php on line 141
Warning: DOMDocument::loadHTML(): Unexpected end tag : a in Entity, line: 237 in /home/u552734802/domains/dailystocktopick.com/public_html/index.php on line 141
Warning: DOMDocument::loadHTML(): Unexpected end tag : a in Entity, line: 237 in /home/u552734802/domains/dailystocktopick.com/public_html/index.php on line 141
Warning: DOMDocument::loadHTML(): Unexpected end tag : a in Entity, line: 237 in /home/u552734802/domains/dailystocktopick.com/public_html/index.php on line 141
Warning: DOMDocument::loadHTML(): Unexpected end tag : a in Entity, line: 237 in /home/u552734802/domains/dailystocktopick.com/public_html/index.php on line 141
Warning: DOMDocument::loadHTML(): Unexpected end tag : a in Entity, line: 237 in /home/u552734802/domains/dailystocktopick.com/public_html/index.php on line 141
Warning: DOMDocument::loadHTML(): Unexpected end tag : a in Entity, line: 237 in /home/u552734802/domains/dailystocktopick.com/public_html/index.php on line 141
Warning: DOMDocument::loadHTML(): Unexpected end tag : a in Entity, line: 237 in /home/u552734802/domains/dailystocktopick.com/public_html/index.php on line 141
Warning: DOMDocument::loadHTML(): Unexpected end tag : a in Entity, line: 237 in /home/u552734802/domains/dailystocktopick.com/public_html/index.php on line 141
Warning: DOMDocument::loadHTML(): Unexpected end tag : a in Entity, line: 237 in /home/u552734802/domains/dailystocktopick.com/public_html/index.php on line 141
Warning: DOMDocument::loadHTML(): Unexpected end tag : a in Entity, line: 237 in /home/u552734802/domains/dailystocktopick.com/public_html/index.php on line 141
Warning: DOMDocument::loadHTML(): Unexpected end tag : a in Entity, line: 237 in /home/u552734802/domains/dailystocktopick.com/public_html/index.php on line 141
Warning: DOMDocument::loadHTML(): Unexpected end tag : a in Entity, line: 237 in /home/u552734802/domains/dailystocktopick.com/public_html/index.php on line 141
Warning: DOMDocument::loadHTML(): Unexpected end tag : a in Entity, line: 237 in /home/u552734802/domains/dailystocktopick.com/public_html/index.php on line 141
Warning: DOMDocument::loadHTML(): Unexpected end tag : a in Entity, line: 237 in /home/u552734802/domains/dailystocktopick.com/public_html/index.php on line 141
Warning: DOMDocument::loadHTML(): Unexpected end tag : a in Entity, line: 237 in /home/u552734802/domains/dailystocktopick.com/public_html/index.php on line 141
Warning: DOMDocument::loadHTML(): Unexpected end tag : a in Entity, line: 237 in /home/u552734802/domains/dailystocktopick.com/public_html/index.php on line 141
Warning: DOMDocument::loadHTML(): Unexpected end tag : div in Entity, line: 237 in /home/u552734802/domains/dailystocktopick.com/public_html/index.php on line 141
Warning: DOMDocument::loadHTML(): Unexpected end tag : li in Entity, line: 237 in /home/u552734802/domains/dailystocktopick.com/public_html/index.php on line 141
Warning: DOMDocument::loadHTML(): Unexpected end tag : div in Entity, line: 237 in /home/u552734802/domains/dailystocktopick.com/public_html/index.php on line 141
Warning: DOMDocument::loadHTML(): Unexpected end tag : a in Entity, line: 237 in /home/u552734802/domains/dailystocktopick.com/public_html/index.php on line 141
Warning: DOMDocument::loadHTML(): Unexpected end tag : a in Entity, line: 237 in /home/u552734802/domains/dailystocktopick.com/public_html/index.php on line 141
Warning: DOMDocument::loadHTML(): Unexpected end tag : a in Entity, line: 237 in /home/u552734802/domains/dailystocktopick.com/public_html/index.php on line 141
Warning: DOMDocument::loadHTML(): Unexpected end tag : a in Entity, line: 237 in /home/u552734802/domains/dailystocktopick.com/public_html/index.php on line 141
Warning: DOMDocument::loadHTML(): Unexpected end tag : a in Entity, line: 237 in /home/u552734802/domains/dailystocktopick.com/public_html/index.php on line 141
Warning: DOMDocument::loadHTML(): Unexpected end tag : a in Entity, line: 237 in /home/u552734802/domains/dailystocktopick.com/public_html/index.php on line 141
Warning: DOMDocument::loadHTML(): Unexpected end tag : a in Entity, line: 237 in /home/u552734802/domains/dailystocktopick.com/public_html/index.php on line 141
Warning: DOMDocument::loadHTML(): Unexpected end tag : a in Entity, line: 237 in /home/u552734802/domains/dailystocktopick.com/public_html/index.php on line 141
Warning: DOMDocument::loadHTML(): Unexpected end tag : a in Entity, line: 237 in /home/u552734802/domains/dailystocktopick.com/public_html/index.php on line 141
Warning: DOMDocument::loadHTML(): Unexpected end tag : a in Entity, line: 237 in /home/u552734802/domains/dailystocktopick.com/public_html/index.php on line 141
Warning: DOMDocument::loadHTML(): Unexpected end tag : a in Entity, line: 237 in /home/u552734802/domains/dailystocktopick.com/public_html/index.php on line 141
Warning: DOMDocument::loadHTML(): Unexpected end tag : a in Entity, line: 237 in /home/u552734802/domains/dailystocktopick.com/public_html/index.php on line 141
Warning: DOMDocument::loadHTML(): Unexpected end tag : a in Entity, line: 237 in /home/u552734802/domains/dailystocktopick.com/public_html/index.php on line 141
Warning: DOMDocument::loadHTML(): Unexpected end tag : div in Entity, line: 237 in /home/u552734802/domains/dailystocktopick.com/public_html/index.php on line 141
Warning: DOMDocument::loadHTML(): Unexpected end tag : li in Entity, line: 237 in /home/u552734802/domains/dailystocktopick.com/public_html/index.php on line 141
Warning: DOMDocument::loadHTML(): Unexpected end tag : div in Entity, line: 237 in /home/u552734802/domains/dailystocktopick.com/public_html/index.php on line 141
Warning: DOMDocument::loadHTML(): Unexpected end tag : a in Entity, line: 237 in /home/u552734802/domains/dailystocktopick.com/public_html/index.php on line 141
Warning: DOMDocument::loadHTML(): Unexpected end tag : a in Entity, line: 237 in /home/u552734802/domains/dailystocktopick.com/public_html/index.php on line 141
Warning: DOMDocument::loadHTML(): Unexpected end tag : a in Entity, line: 237 in /home/u552734802/domains/dailystocktopick.com/public_html/index.php on line 141
Warning: DOMDocument::loadHTML(): Unexpected end tag : a in Entity, line: 237 in /home/u552734802/domains/dailystocktopick.com/public_html/index.php on line 141
Warning: DOMDocument::loadHTML(): Unexpected end tag : a in Entity, line: 237 in /home/u552734802/domains/dailystocktopick.com/public_html/index.php on line 141
Warning: DOMDocument::loadHTML(): Unexpected end tag : a in Entity, line: 237 in /home/u552734802/domains/dailystocktopick.com/public_html/index.php on line 141
Warning: DOMDocument::loadHTML(): Unexpected end tag : a in Entity, line: 237 in /home/u552734802/domains/dailystocktopick.com/public_html/index.php on line 141
Warning: DOMDocument::loadHTML(): Unexpected end tag : a in Entity, line: 237 in /home/u552734802/domains/dailystocktopick.com/public_html/index.php on line 141
Warning: DOMDocument::loadHTML(): Unexpected end tag : a in Entity, line: 237 in /home/u552734802/domains/dailystocktopick.com/public_html/index.php on line 141
Warning: DOMDocument::loadHTML(): Unexpected end tag : a in Entity, line: 237 in /home/u552734802/domains/dailystocktopick.com/public_html/index.php on line 141
Warning: DOMDocument::loadHTML(): Unexpected end tag : a in Entity, line: 237 in /home/u552734802/domains/dailystocktopick.com/public_html/index.php on line 141
Warning: DOMDocument::loadHTML(): Unexpected end tag : a in Entity, line: 237 in /home/u552734802/domains/dailystocktopick.com/public_html/index.php on line 141
Warning: DOMDocument::loadHTML(): Unexpected end tag : a in Entity, line: 237 in /home/u552734802/domains/dailystocktopick.com/public_html/index.php on line 141
Warning: DOMDocument::loadHTML(): Unexpected end tag : a in Entity, line: 237 in /home/u552734802/domains/dailystocktopick.com/public_html/index.php on line 141
Warning: DOMDocument::loadHTML(): Unexpected end tag : a in Entity, line: 237 in /home/u552734802/domains/dailystocktopick.com/public_html/index.php on line 141
Warning: DOMDocument::loadHTML(): Unexpected end tag : div in Entity, line: 237 in /home/u552734802/domains/dailystocktopick.com/public_html/index.php on line 141
Warning: DOMDocument::loadHTML(): Unexpected end tag : li in Entity, line: 237 in /home/u552734802/domains/dailystocktopick.com/public_html/index.php on line 141
Warning: DOMDocument::loadHTML(): Unexpected end tag : div in Entity, line: 237 in /home/u552734802/domains/dailystocktopick.com/public_html/index.php on line 141
Warning: DOMDocument::loadHTML(): Unexpected end tag : a in Entity, line: 237 in /home/u552734802/domains/dailystocktopick.com/public_html/index.php on line 141
Warning: DOMDocument::loadHTML(): Unexpected end tag : a in Entity, line: 237 in /home/u552734802/domains/dailystocktopick.com/public_html/index.php on line 141
Warning: DOMDocument::loadHTML(): Unexpected end tag : a in Entity, line: 237 in /home/u552734802/domains/dailystocktopick.com/public_html/index.php on line 141
Warning: DOMDocument::loadHTML(): Unexpected end tag : a in Entity, line: 237 in /home/u552734802/domains/dailystocktopick.com/public_html/index.php on line 141
Warning: DOMDocument::loadHTML(): Unexpected end tag : a in Entity, line: 237 in /home/u552734802/domains/dailystocktopick.com/public_html/index.php on line 141
Warning: DOMDocument::loadHTML(): Unexpected end tag : a in Entity, line: 237 in /home/u552734802/domains/dailystocktopick.com/public_html/index.php on line 141
Warning: DOMDocument::loadHTML(): Unexpected end tag : a in Entity, line: 237 in /home/u552734802/domains/dailystocktopick.com/public_html/index.php on line 141
Warning: DOMDocument::loadHTML(): Unexpected end tag : a in Entity, line: 237 in /home/u552734802/domains/dailystocktopick.com/public_html/index.php on line 141
Warning: DOMDocument::loadHTML(): Unexpected end tag : a in Entity, line: 237 in /home/u552734802/domains/dailystocktopick.com/public_html/index.php on line 141
Warning: DOMDocument::loadHTML(): Unexpected end tag : a in Entity, line: 237 in /home/u552734802/domains/dailystocktopick.com/public_html/index.php on line 141
Warning: DOMDocument::loadHTML(): Unexpected end tag : div in Entity, line: 237 in /home/u552734802/domains/dailystocktopick.com/public_html/index.php on line 141
Warning: DOMDocument::loadHTML(): Unexpected end tag : li in Entity, line: 237 in /home/u552734802/domains/dailystocktopick.com/public_html/index.php on line 141
Warning: DOMDocument::loadHTML(): Unexpected end tag : div in Entity, line: 237 in /home/u552734802/domains/dailystocktopick.com/public_html/index.php on line 141
Warning: DOMDocument::loadHTML(): Unexpected end tag : a in Entity, line: 237 in /home/u552734802/domains/dailystocktopick.com/public_html/index.php on line 141
Warning: DOMDocument::loadHTML(): Unexpected end tag : a in Entity, line: 237 in /home/u552734802/domains/dailystocktopick.com/public_html/index.php on line 141
Warning: DOMDocument::loadHTML(): Unexpected end tag : a in Entity, line: 237 in /home/u552734802/domains/dailystocktopick.com/public_html/index.php on line 141
Warning: DOMDocument::loadHTML(): Unexpected end tag : a in Entity, line: 237 in /home/u552734802/domains/dailystocktopick.com/public_html/index.php on line 141
Warning: DOMDocument::loadHTML(): Unexpected end tag : a in Entity, line: 237 in /home/u552734802/domains/dailystocktopick.com/public_html/index.php on line 141
Warning: DOMDocument::loadHTML(): Unexpected end tag : a in Entity, line: 237 in /home/u552734802/domains/dailystocktopick.com/public_html/index.php on line 141
Warning: DOMDocument::loadHTML(): Unexpected end tag : a in Entity, line: 237 in /home/u552734802/domains/dailystocktopick.com/public_html/index.php on line 141
Warning: DOMDocument::loadHTML(): Unexpected end tag : a in Entity, line: 237 in /home/u552734802/domains/dailystocktopick.com/public_html/index.php on line 141
Warning: DOMDocument::loadHTML(): Unexpected end tag : a in Entity, line: 237 in /home/u552734802/domains/dailystocktopick.com/public_html/index.php on line 141
Warning: DOMDocument::loadHTML(): Unexpected end tag : a in Entity, line: 237 in /home/u552734802/domains/dailystocktopick.com/public_html/index.php on line 141
Warning: DOMDocument::loadHTML(): Unexpected end tag : a in Entity, line: 237 in /home/u552734802/domains/dailystocktopick.com/public_html/index.php on line 141
Warning: DOMDocument::loadHTML(): Unexpected end tag : a in Entity, line: 237 in /home/u552734802/domains/dailystocktopick.com/public_html/index.php on line 141
Warning: DOMDocument::loadHTML(): Unexpected end tag : a in Entity, line: 237 in /home/u552734802/domains/dailystocktopick.com/public_html/index.php on line 141
Warning: DOMDocument::loadHTML(): Unexpected end tag : a in Entity, line: 237 in /home/u552734802/domains/dailystocktopick.com/public_html/index.php on line 141
Warning: DOMDocument::loadHTML(): Unexpected end tag : a in Entity, line: 237 in /home/u552734802/domains/dailystocktopick.com/public_html/index.php on line 141
Warning: DOMDocument::loadHTML(): Unexpected end tag : a in Entity, line: 237 in /home/u552734802/domains/dailystocktopick.com/public_html/index.php on line 141
Warning: DOMDocument::loadHTML(): Unexpected end tag : a in Entity, line: 237 in /home/u552734802/domains/dailystocktopick.com/public_html/index.php on line 141
Warning: DOMDocument::loadHTML(): Unexpected end tag : a in Entity, line: 237 in /home/u552734802/domains/dailystocktopick.com/public_html/index.php on line 141
Warning: DOMDocument::loadHTML(): Unexpected end tag : a in Entity, line: 237 in /home/u552734802/domains/dailystocktopick.com/public_html/index.php on line 141
Warning: DOMDocument::loadHTML(): Unexpected end tag : div in Entity, line: 237 in /home/u552734802/domains/dailystocktopick.com/public_html/index.php on line 141
Warning: DOMDocument::loadHTML(): Unexpected end tag : li in Entity, line: 237 in /home/u552734802/domains/dailystocktopick.com/public_html/index.php on line 141
Warning: DOMDocument::loadHTML(): Unexpected end tag : div in Entity, line: 237 in /home/u552734802/domains/dailystocktopick.com/public_html/index.php on line 141
Warning: DOMDocument::loadHTML(): Unexpected end tag : a in Entity, line: 237 in /home/u552734802/domains/dailystocktopick.com/public_html/index.php on line 141
Warning: DOMDocument::loadHTML(): Unexpected end tag : a in Entity, line: 237 in /home/u552734802/domains/dailystocktopick.com/public_html/index.php on line 141
Warning: DOMDocument::loadHTML(): Unexpected end tag : a in Entity, line: 237 in /home/u552734802/domains/dailystocktopick.com/public_html/index.php on line 141
Warning: DOMDocument::loadHTML(): Unexpected end tag : a in Entity, line: 237 in /home/u552734802/domains/dailystocktopick.com/public_html/index.php on line 141
Warning: DOMDocument::loadHTML(): Unexpected end tag : a in Entity, line: 237 in /home/u552734802/domains/dailystocktopick.com/public_html/index.php on line 141
Warning: DOMDocument::loadHTML(): Unexpected end tag : a in Entity, line: 237 in /home/u552734802/domains/dailystocktopick.com/public_html/index.php on line 141
Warning: DOMDocument::loadHTML(): Unexpected end tag : a in Entity, line: 237 in /home/u552734802/domains/dailystocktopick.com/public_html/index.php on line 141
Warning: DOMDocument::loadHTML(): Unexpected end tag : a in Entity, line: 237 in /home/u552734802/domains/dailystocktopick.com/public_html/index.php on line 141
Warning: DOMDocument::loadHTML(): Unexpected end tag : a in Entity, line: 237 in /home/u552734802/domains/dailystocktopick.com/public_html/index.php on line 141
Warning: DOMDocument::loadHTML(): Unexpected end tag : a in Entity, line: 237 in /home/u552734802/domains/dailystocktopick.com/public_html/index.php on line 141
Warning: DOMDocument::loadHTML(): Unexpected end tag : a in Entity, line: 237 in /home/u552734802/domains/dailystocktopick.com/public_html/index.php on line 141
Warning: DOMDocument::loadHTML(): Unexpected end tag : a in Entity, line: 237 in /home/u552734802/domains/dailystocktopick.com/public_html/index.php on line 141
Warning: DOMDocument::loadHTML(): Unexpected end tag : a in Entity, line: 237 in /home/u552734802/domains/dailystocktopick.com/public_html/index.php on line 141
Warning: DOMDocument::loadHTML(): Unexpected end tag : div in Entity, line: 237 in /home/u552734802/domains/dailystocktopick.com/public_html/index.php on line 141
Warning: DOMDocument::loadHTML(): Unexpected end tag : li in Entity, line: 237 in /home/u552734802/domains/dailystocktopick.com/public_html/index.php on line 141
Warning: DOMDocument::loadHTML(): Unexpected end tag : div in Entity, line: 237 in /home/u552734802/domains/dailystocktopick.com/public_html/index.php on line 141
Warning: DOMDocument::loadHTML(): Unexpected end tag : a in Entity, line: 237 in /home/u552734802/domains/dailystocktopick.com/public_html/index.php on line 141
Warning: DOMDocument::loadHTML(): Unexpected end tag : a in Entity, line: 237 in /home/u552734802/domains/dailystocktopick.com/public_html/index.php on line 141
Warning: DOMDocument::loadHTML(): Unexpected end tag : a in Entity, line: 237 in /home/u552734802/domains/dailystocktopick.com/public_html/index.php on line 141
Warning: DOMDocument::loadHTML(): Unexpected end tag : a in Entity, line: 237 in /home/u552734802/domains/dailystocktopick.com/public_html/index.php on line 141
Warning: DOMDocument::loadHTML(): Unexpected end tag : a in Entity, line: 237 in /home/u552734802/domains/dailystocktopick.com/public_html/index.php on line 141
Warning: DOMDocument::loadHTML(): Unexpected end tag : a in Entity, line: 237 in /home/u552734802/domains/dailystocktopick.com/public_html/index.php on line 141
Warning: DOMDocument::loadHTML(): Unexpected end tag : a in Entity, line: 237 in /home/u552734802/domains/dailystocktopick.com/public_html/index.php on line 141
Warning: DOMDocument::loadHTML(): Unexpected end tag : a in Entity, line: 237 in /home/u552734802/domains/dailystocktopick.com/public_html/index.php on line 141
Warning: DOMDocument::loadHTML(): Unexpected end tag : div in Entity, line: 237 in /home/u552734802/domains/dailystocktopick.com/public_html/index.php on line 141
Warning: DOMDocument::loadHTML(): Unexpected end tag : li in Entity, line: 237 in /home/u552734802/domains/dailystocktopick.com/public_html/index.php on line 141
Warning: DOMDocument::loadHTML(): Unexpected end tag : div in Entity, line: 237 in /home/u552734802/domains/dailystocktopick.com/public_html/index.php on line 141
Warning: DOMDocument::loadHTML(): Unexpected end tag : a in Entity, line: 237 in /home/u552734802/domains/dailystocktopick.com/public_html/index.php on line 141
Warning: DOMDocument::loadHTML(): Unexpected end tag : a in Entity, line: 237 in /home/u552734802/domains/dailystocktopick.com/public_html/index.php on line 141
Warning: DOMDocument::loadHTML(): Unexpected end tag : a in Entity, line: 237 in /home/u552734802/domains/dailystocktopick.com/public_html/index.php on line 141
Warning: DOMDocument::loadHTML(): Unexpected end tag : a in Entity, line: 237 in /home/u552734802/domains/dailystocktopick.com/public_html/index.php on line 141
Warning: DOMDocument::loadHTML(): Unexpected end tag : a in Entity, line: 237 in /home/u552734802/domains/dailystocktopick.com/public_html/index.php on line 141
Warning: DOMDocument::loadHTML(): Unexpected end tag : a in Entity, line: 237 in /home/u552734802/domains/dailystocktopick.com/public_html/index.php on line 141
Warning: DOMDocument::loadHTML(): Unexpected end tag : a in Entity, line: 237 in /home/u552734802/domains/dailystocktopick.com/public_html/index.php on line 141
Warning: DOMDocument::loadHTML(): Unexpected end tag : a in Entity, line: 237 in /home/u552734802/domains/dailystocktopick.com/public_html/index.php on line 141
Warning: DOMDocument::loadHTML(): Unexpected end tag : a in Entity, line: 237 in /home/u552734802/domains/dailystocktopick.com/public_html/index.php on line 141
Warning: DOMDocument::loadHTML(): Unexpected end tag : a in Entity, line: 237 in /home/u552734802/domains/dailystocktopick.com/public_html/index.php on line 141
Warning: DOMDocument::loadHTML(): Unexpected end tag : a in Entity, line: 237 in /home/u552734802/domains/dailystocktopick.com/public_html/index.php on line 141
Warning: DOMDocument::loadHTML(): Unexpected end tag : a in Entity, line: 237 in /home/u552734802/domains/dailystocktopick.com/public_html/index.php on line 141
Warning: DOMDocument::loadHTML(): Unexpected end tag : a in Entity, line: 237 in /home/u552734802/domains/dailystocktopick.com/public_html/index.php on line 141
Warning: DOMDocument::loadHTML(): Unexpected end tag : a in Entity, line: 237 in /home/u552734802/domains/dailystocktopick.com/public_html/index.php on line 141
Warning: DOMDocument::loadHTML(): Unexpected end tag : a in Entity, line: 237 in /home/u552734802/domains/dailystocktopick.com/public_html/index.php on line 141
Warning: DOMDocument::loadHTML(): Unexpected end tag : a in Entity, line: 237 in /home/u552734802/domains/dailystocktopick.com/public_html/index.php on line 141
Warning: DOMDocument::loadHTML(): Unexpected end tag : div in Entity, line: 237 in /home/u552734802/domains/dailystocktopick.com/public_html/index.php on line 141
Warning: DOMDocument::loadHTML(): Unexpected end tag : li in Entity, line: 237 in /home/u552734802/domains/dailystocktopick.com/public_html/index.php on line 141
Warning: DOMDocument::loadHTML(): Unexpected end tag : div in Entity, line: 237 in /home/u552734802/domains/dailystocktopick.com/public_html/index.php on line 141
Warning: DOMDocument::loadHTML(): Unexpected end tag : a in Entity, line: 237 in /home/u552734802/domains/dailystocktopick.com/public_html/index.php on line 141
Warning: DOMDocument::loadHTML(): Unexpected end tag : a in Entity, line: 237 in /home/u552734802/domains/dailystocktopick.com/public_html/index.php on line 141
Warning: DOMDocument::loadHTML(): Unexpected end tag : a in Entity, line: 237 in /home/u552734802/domains/dailystocktopick.com/public_html/index.php on line 141
Warning: DOMDocument::loadHTML(): Unexpected end tag : a in Entity, line: 237 in /home/u552734802/domains/dailystocktopick.com/public_html/index.php on line 141
Warning: DOMDocument::loadHTML(): Unexpected end tag : a in Entity, line: 237 in /home/u552734802/domains/dailystocktopick.com/public_html/index.php on line 141
Warning: DOMDocument::loadHTML(): Unexpected end tag : a in Entity, line: 237 in /home/u552734802/domains/dailystocktopick.com/public_html/index.php on line 141
Warning: DOMDocument::loadHTML(): Unexpected end tag : a in Entity, line: 237 in /home/u552734802/domains/dailystocktopick.com/public_html/index.php on line 141
Warning: DOMDocument::loadHTML(): Unexpected end tag : a in Entity, line: 237 in /home/u552734802/domains/dailystocktopick.com/public_html/index.php on line 141
Warning: DOMDocument::loadHTML(): Unexpected end tag : a in Entity, line: 237 in /home/u552734802/domains/dailystocktopick.com/public_html/index.php on line 141
Warning: DOMDocument::loadHTML(): Unexpected end tag : a in Entity, line: 237 in /home/u552734802/domains/dailystocktopick.com/public_html/index.php on line 141
Warning: DOMDocument::loadHTML(): Unexpected end tag : a in Entity, line: 237 in /home/u552734802/domains/dailystocktopick.com/public_html/index.php on line 141
Warning: DOMDocument::loadHTML(): Unexpected end tag : a in Entity, line: 237 in /home/u552734802/domains/dailystocktopick.com/public_html/index.php on line 141
Warning: DOMDocument::loadHTML(): Unexpected end tag : a in Entity, line: 237 in /home/u552734802/domains/dailystocktopick.com/public_html/index.php on line 141
Warning: DOMDocument::loadHTML(): Unexpected end tag : a in Entity, line: 237 in /home/u552734802/domains/dailystocktopick.com/public_html/index.php on line 141
Warning: DOMDocument::loadHTML(): Unexpected end tag : a in Entity, line: 237 in /home/u552734802/domains/dailystocktopick.com/public_html/index.php on line 141
Warning: DOMDocument::loadHTML(): Unexpected end tag : div in Entity, line: 237 in /home/u552734802/domains/dailystocktopick.com/public_html/index.php on line 141
Warning: DOMDocument::loadHTML(): Unexpected end tag : li in Entity, line: 237 in /home/u552734802/domains/dailystocktopick.com/public_html/index.php on line 141
Warning: DOMDocument::loadHTML(): Unexpected end tag : div in Entity, line: 237 in /home/u552734802/domains/dailystocktopick.com/public_html/index.php on line 141
Warning: DOMDocument::loadHTML(): Unexpected end tag : a in Entity, line: 237 in /home/u552734802/domains/dailystocktopick.com/public_html/index.php on line 141
Warning: DOMDocument::loadHTML(): Unexpected end tag : a in Entity, line: 237 in /home/u552734802/domains/dailystocktopick.com/public_html/index.php on line 141
Warning: DOMDocument::loadHTML(): Unexpected end tag : a in Entity, line: 237 in /home/u552734802/domains/dailystocktopick.com/public_html/index.php on line 141
Warning: DOMDocument::loadHTML(): Unexpected end tag : a in Entity, line: 237 in /home/u552734802/domains/dailystocktopick.com/public_html/index.php on line 141
Warning: DOMDocument::loadHTML(): Unexpected end tag : a in Entity, line: 237 in /home/u552734802/domains/dailystocktopick.com/public_html/index.php on line 141
Warning: DOMDocument::loadHTML(): Unexpected end tag : a in Entity, line: 237 in /home/u552734802/domains/dailystocktopick.com/public_html/index.php on line 141
Warning: DOMDocument::loadHTML(): Unexpected end tag : a in Entity, line: 237 in /home/u552734802/domains/dailystocktopick.com/public_html/index.php on line 141
Warning: DOMDocument::loadHTML(): Unexpected end tag : a in Entity, line: 237 in /home/u552734802/domains/dailystocktopick.com/public_html/index.php on line 141
Warning: DOMDocument::loadHTML(): Unexpected end tag : a in Entity, line: 237 in /home/u552734802/domains/dailystocktopick.com/public_html/index.php on line 141
Warning: DOMDocument::loadHTML(): Unexpected end tag : a in Entity, line: 237 in /home/u552734802/domains/dailystocktopick.com/public_html/index.php on line 141
Warning: DOMDocument::loadHTML(): Unexpected end tag : a in Entity, line: 237 in /home/u552734802/domains/dailystocktopick.com/public_html/index.php on line 141
Warning: DOMDocument::loadHTML(): Unexpected end tag : a in Entity, line: 237 in /home/u552734802/domains/dailystocktopick.com/public_html/index.php on line 141
Warning: DOMDocument::loadHTML(): Unexpected end tag : a in Entity, line: 237 in /home/u552734802/domains/dailystocktopick.com/public_html/index.php on line 141
Warning: DOMDocument::loadHTML(): Unexpected end tag : a in Entity, line: 237 in /home/u552734802/domains/dailystocktopick.com/public_html/index.php on line 141
Warning: DOMDocument::loadHTML(): Unexpected end tag : a in Entity, line: 237 in /home/u552734802/domains/dailystocktopick.com/public_html/index.php on line 141
Warning: DOMDocument::loadHTML(): Unexpected end tag : a in Entity, line: 237 in /home/u552734802/domains/dailystocktopick.com/public_html/index.php on line 141
Warning: DOMDocument::loadHTML(): Unexpected end tag : a in Entity, line: 237 in /home/u552734802/domains/dailystocktopick.com/public_html/index.php on line 141
Warning: DOMDocument::loadHTML(): Unexpected end tag : div in Entity, line: 237 in /home/u552734802/domains/dailystocktopick.com/public_html/index.php on line 141
Warning: DOMDocument::loadHTML(): Unexpected end tag : li in Entity, line: 237 in /home/u552734802/domains/dailystocktopick.com/public_html/index.php on line 141
Warning: DOMDocument::loadHTML(): Unexpected end tag : div in Entity, line: 237 in /home/u552734802/domains/dailystocktopick.com/public_html/index.php on line 141
Warning: DOMDocument::loadHTML(): Unexpected end tag : a in Entity, line: 237 in /home/u552734802/domains/dailystocktopick.com/public_html/index.php on line 141
Warning: DOMDocument::loadHTML(): Unexpected end tag : a in Entity, line: 237 in /home/u552734802/domains/dailystocktopick.com/public_html/index.php on line 141
Warning: DOMDocument::loadHTML(): Unexpected end tag : a in Entity, line: 237 in /home/u552734802/domains/dailystocktopick.com/public_html/index.php on line 141
Warning: DOMDocument::loadHTML(): Unexpected end tag : a in Entity, line: 237 in /home/u552734802/domains/dailystocktopick.com/public_html/index.php on line 141
Warning: DOMDocument::loadHTML(): Unexpected end tag : a in Entity, line: 237 in /home/u552734802/domains/dailystocktopick.com/public_html/index.php on line 141
Warning: DOMDocument::loadHTML(): Unexpected end tag : a in Entity, line: 237 in /home/u552734802/domains/dailystocktopick.com/public_html/index.php on line 141
Warning: DOMDocument::loadHTML(): Unexpected end tag : a in Entity, line: 237 in /home/u552734802/domains/dailystocktopick.com/public_html/index.php on line 141
Warning: DOMDocument::loadHTML(): Unexpected end tag : a in Entity, line: 237 in /home/u552734802/domains/dailystocktopick.com/public_html/index.php on line 141
Warning: DOMDocument::loadHTML(): Unexpected end tag : a in Entity, line: 237 in /home/u552734802/domains/dailystocktopick.com/public_html/index.php on line 141
Warning: DOMDocument::loadHTML(): Unexpected end tag : a in Entity, line: 237 in /home/u552734802/domains/dailystocktopick.com/public_html/index.php on line 141
Warning: DOMDocument::loadHTML(): Unexpected end tag : a in Entity, line: 237 in /home/u552734802/domains/dailystocktopick.com/public_html/index.php on line 141
Warning: DOMDocument::loadHTML(): Unexpected end tag : a in Entity, line: 237 in /home/u552734802/domains/dailystocktopick.com/public_html/index.php on line 141
Warning: DOMDocument::loadHTML(): Unexpected end tag : a in Entity, line: 237 in /home/u552734802/domains/dailystocktopick.com/public_html/index.php on line 141
Warning: DOMDocument::loadHTML(): Unexpected end tag : div in Entity, line: 237 in /home/u552734802/domains/dailystocktopick.com/public_html/index.php on line 141
Warning: DOMDocument::loadHTML(): Unexpected end tag : li in Entity, line: 237 in /home/u552734802/domains/dailystocktopick.com/public_html/index.php on line 141
Warning: DOMDocument::loadHTML(): Unexpected end tag : ul in Entity, line: 237 in /home/u552734802/domains/dailystocktopick.com/public_html/index.php on line 141
Warning: DOMDocument::loadHTML(): Unexpected end tag : h2 in Entity, line: 252 in /home/u552734802/domains/dailystocktopick.com/public_html/index.php on line 141
Warning: DOMDocument::loadHTML(): Unexpected end tag : p in Entity, line: 253 in /home/u552734802/domains/dailystocktopick.com/public_html/index.php on line 141
Warning: DOMDocument::loadHTML(): Unexpected end tag : button in Entity, line: 256 in /home/u552734802/domains/dailystocktopick.com/public_html/index.php on line 141
Warning: DOMDocument::loadHTML(): Unexpected end tag : div in Entity, line: 257 in /home/u552734802/domains/dailystocktopick.com/public_html/index.php on line 141
| Airbnb Inc | |||
| Symbol: | ABNB | Current: | 151.52 |
| Breakout: | 154.25 | Target: | 162.28 |
| Support: | 146.70 | Resist: | 152.43 |
| Volume: | 2.4mil shares -37.9% compared to typical volume of 3.9mil | ||
|
|
|||
Warning: DOMDocument::loadHTML(): Unexpected end tag : i in Entity, line: 237 in /home/u552734802/domains/dailystocktopick.com/public_html/index.php on line 141
Warning: DOMDocument::loadHTML(): Unexpected end tag : span in Entity, line: 237 in /home/u552734802/domains/dailystocktopick.com/public_html/index.php on line 141
Warning: DOMDocument::loadHTML(): Unexpected end tag : div in Entity, line: 237 in /home/u552734802/domains/dailystocktopick.com/public_html/index.php on line 141
Warning: DOMDocument::loadHTML(): Unexpected end tag : div in Entity, line: 237 in /home/u552734802/domains/dailystocktopick.com/public_html/index.php on line 141
Warning: DOMDocument::loadHTML(): Unexpected end tag : a in Entity, line: 237 in /home/u552734802/domains/dailystocktopick.com/public_html/index.php on line 141
Warning: DOMDocument::loadHTML(): Unexpected end tag : a in Entity, line: 237 in /home/u552734802/domains/dailystocktopick.com/public_html/index.php on line 141
Warning: DOMDocument::loadHTML(): Unexpected end tag : a in Entity, line: 237 in /home/u552734802/domains/dailystocktopick.com/public_html/index.php on line 141
Warning: DOMDocument::loadHTML(): Unexpected end tag : a in Entity, line: 237 in /home/u552734802/domains/dailystocktopick.com/public_html/index.php on line 141
Warning: DOMDocument::loadHTML(): Unexpected end tag : a in Entity, line: 237 in /home/u552734802/domains/dailystocktopick.com/public_html/index.php on line 141
Warning: DOMDocument::loadHTML(): Unexpected end tag : a in Entity, line: 237 in /home/u552734802/domains/dailystocktopick.com/public_html/index.php on line 141
Warning: DOMDocument::loadHTML(): Unexpected end tag : a in Entity, line: 237 in /home/u552734802/domains/dailystocktopick.com/public_html/index.php on line 141
Warning: DOMDocument::loadHTML(): Unexpected end tag : a in Entity, line: 237 in /home/u552734802/domains/dailystocktopick.com/public_html/index.php on line 141
Warning: DOMDocument::loadHTML(): Unexpected end tag : a in Entity, line: 237 in /home/u552734802/domains/dailystocktopick.com/public_html/index.php on line 141
Warning: DOMDocument::loadHTML(): Unexpected end tag : a in Entity, line: 237 in /home/u552734802/domains/dailystocktopick.com/public_html/index.php on line 141
Warning: DOMDocument::loadHTML(): Unexpected end tag : a in Entity, line: 237 in /home/u552734802/domains/dailystocktopick.com/public_html/index.php on line 141
Warning: DOMDocument::loadHTML(): Unexpected end tag : div in Entity, line: 237 in /home/u552734802/domains/dailystocktopick.com/public_html/index.php on line 141
Warning: DOMDocument::loadHTML(): Unexpected end tag : li in Entity, line: 237 in /home/u552734802/domains/dailystocktopick.com/public_html/index.php on line 141
Warning: DOMDocument::loadHTML(): Unexpected end tag : div in Entity, line: 237 in /home/u552734802/domains/dailystocktopick.com/public_html/index.php on line 141
Warning: DOMDocument::loadHTML(): Unexpected end tag : a in Entity, line: 237 in /home/u552734802/domains/dailystocktopick.com/public_html/index.php on line 141
Warning: DOMDocument::loadHTML(): Unexpected end tag : a in Entity, line: 237 in /home/u552734802/domains/dailystocktopick.com/public_html/index.php on line 141
Warning: DOMDocument::loadHTML(): Unexpected end tag : a in Entity, line: 237 in /home/u552734802/domains/dailystocktopick.com/public_html/index.php on line 141
Warning: DOMDocument::loadHTML(): Unexpected end tag : a in Entity, line: 237 in /home/u552734802/domains/dailystocktopick.com/public_html/index.php on line 141
Warning: DOMDocument::loadHTML(): Unexpected end tag : a in Entity, line: 237 in /home/u552734802/domains/dailystocktopick.com/public_html/index.php on line 141
Warning: DOMDocument::loadHTML(): Unexpected end tag : a in Entity, line: 237 in /home/u552734802/domains/dailystocktopick.com/public_html/index.php on line 141
Warning: DOMDocument::loadHTML(): Unexpected end tag : a in Entity, line: 237 in /home/u552734802/domains/dailystocktopick.com/public_html/index.php on line 141
Warning: DOMDocument::loadHTML(): Unexpected end tag : a in Entity, line: 237 in /home/u552734802/domains/dailystocktopick.com/public_html/index.php on line 141
Warning: DOMDocument::loadHTML(): Unexpected end tag : a in Entity, line: 237 in /home/u552734802/domains/dailystocktopick.com/public_html/index.php on line 141
Warning: DOMDocument::loadHTML(): Unexpected end tag : a in Entity, line: 237 in /home/u552734802/domains/dailystocktopick.com/public_html/index.php on line 141
Warning: DOMDocument::loadHTML(): Unexpected end tag : a in Entity, line: 237 in /home/u552734802/domains/dailystocktopick.com/public_html/index.php on line 141
Warning: DOMDocument::loadHTML(): Unexpected end tag : a in Entity, line: 237 in /home/u552734802/domains/dailystocktopick.com/public_html/index.php on line 141
Warning: DOMDocument::loadHTML(): Unexpected end tag : div in Entity, line: 237 in /home/u552734802/domains/dailystocktopick.com/public_html/index.php on line 141
Warning: DOMDocument::loadHTML(): Unexpected end tag : li in Entity, line: 237 in /home/u552734802/domains/dailystocktopick.com/public_html/index.php on line 141
Warning: DOMDocument::loadHTML(): Unexpected end tag : div in Entity, line: 237 in /home/u552734802/domains/dailystocktopick.com/public_html/index.php on line 141
Warning: DOMDocument::loadHTML(): Unexpected end tag : a in Entity, line: 237 in /home/u552734802/domains/dailystocktopick.com/public_html/index.php on line 141
Warning: DOMDocument::loadHTML(): Unexpected end tag : a in Entity, line: 237 in /home/u552734802/domains/dailystocktopick.com/public_html/index.php on line 141
Warning: DOMDocument::loadHTML(): Unexpected end tag : a in Entity, line: 237 in /home/u552734802/domains/dailystocktopick.com/public_html/index.php on line 141
Warning: DOMDocument::loadHTML(): Unexpected end tag : a in Entity, line: 237 in /home/u552734802/domains/dailystocktopick.com/public_html/index.php on line 141
Warning: DOMDocument::loadHTML(): Unexpected end tag : a in Entity, line: 237 in /home/u552734802/domains/dailystocktopick.com/public_html/index.php on line 141
Warning: DOMDocument::loadHTML(): Unexpected end tag : a in Entity, line: 237 in /home/u552734802/domains/dailystocktopick.com/public_html/index.php on line 141
Warning: DOMDocument::loadHTML(): Unexpected end tag : a in Entity, line: 237 in /home/u552734802/domains/dailystocktopick.com/public_html/index.php on line 141
Warning: DOMDocument::loadHTML(): Unexpected end tag : a in Entity, line: 237 in /home/u552734802/domains/dailystocktopick.com/public_html/index.php on line 141
Warning: DOMDocument::loadHTML(): Unexpected end tag : div in Entity, line: 237 in /home/u552734802/domains/dailystocktopick.com/public_html/index.php on line 141
Warning: DOMDocument::loadHTML(): Unexpected end tag : li in Entity, line: 237 in /home/u552734802/domains/dailystocktopick.com/public_html/index.php on line 141
Warning: DOMDocument::loadHTML(): Unexpected end tag : div in Entity, line: 237 in /home/u552734802/domains/dailystocktopick.com/public_html/index.php on line 141
Warning: DOMDocument::loadHTML(): Unexpected end tag : a in Entity, line: 237 in /home/u552734802/domains/dailystocktopick.com/public_html/index.php on line 141
Warning: DOMDocument::loadHTML(): Unexpected end tag : a in Entity, line: 237 in /home/u552734802/domains/dailystocktopick.com/public_html/index.php on line 141
Warning: DOMDocument::loadHTML(): Unexpected end tag : a in Entity, line: 237 in /home/u552734802/domains/dailystocktopick.com/public_html/index.php on line 141
Warning: DOMDocument::loadHTML(): Unexpected end tag : a in Entity, line: 237 in /home/u552734802/domains/dailystocktopick.com/public_html/index.php on line 141
Warning: DOMDocument::loadHTML(): Unexpected end tag : a in Entity, line: 237 in /home/u552734802/domains/dailystocktopick.com/public_html/index.php on line 141
Warning: DOMDocument::loadHTML(): Unexpected end tag : a in Entity, line: 237 in /home/u552734802/domains/dailystocktopick.com/public_html/index.php on line 141
Warning: DOMDocument::loadHTML(): Unexpected end tag : a in Entity, line: 237 in /home/u552734802/domains/dailystocktopick.com/public_html/index.php on line 141
Warning: DOMDocument::loadHTML(): Unexpected end tag : a in Entity, line: 237 in /home/u552734802/domains/dailystocktopick.com/public_html/index.php on line 141
Warning: DOMDocument::loadHTML(): Unexpected end tag : a in Entity, line: 237 in /home/u552734802/domains/dailystocktopick.com/public_html/index.php on line 141
Warning: DOMDocument::loadHTML(): Unexpected end tag : a in Entity, line: 237 in /home/u552734802/domains/dailystocktopick.com/public_html/index.php on line 141
Warning: DOMDocument::loadHTML(): Unexpected end tag : a in Entity, line: 237 in /home/u552734802/domains/dailystocktopick.com/public_html/index.php on line 141
Warning: DOMDocument::loadHTML(): Unexpected end tag : a in Entity, line: 237 in /home/u552734802/domains/dailystocktopick.com/public_html/index.php on line 141
Warning: DOMDocument::loadHTML(): Unexpected end tag : div in Entity, line: 237 in /home/u552734802/domains/dailystocktopick.com/public_html/index.php on line 141
Warning: DOMDocument::loadHTML(): Unexpected end tag : li in Entity, line: 237 in /home/u552734802/domains/dailystocktopick.com/public_html/index.php on line 141
Warning: DOMDocument::loadHTML(): Unexpected end tag : div in Entity, line: 237 in /home/u552734802/domains/dailystocktopick.com/public_html/index.php on line 141
Warning: DOMDocument::loadHTML(): Unexpected end tag : a in Entity, line: 237 in /home/u552734802/domains/dailystocktopick.com/public_html/index.php on line 141
Warning: DOMDocument::loadHTML(): Unexpected end tag : a in Entity, line: 237 in /home/u552734802/domains/dailystocktopick.com/public_html/index.php on line 141
Warning: DOMDocument::loadHTML(): Unexpected end tag : a in Entity, line: 237 in /home/u552734802/domains/dailystocktopick.com/public_html/index.php on line 141
Warning: DOMDocument::loadHTML(): Unexpected end tag : a in Entity, line: 237 in /home/u552734802/domains/dailystocktopick.com/public_html/index.php on line 141
Warning: DOMDocument::loadHTML(): Unexpected end tag : a in Entity, line: 237 in /home/u552734802/domains/dailystocktopick.com/public_html/index.php on line 141
Warning: DOMDocument::loadHTML(): Unexpected end tag : a in Entity, line: 237 in /home/u552734802/domains/dailystocktopick.com/public_html/index.php on line 141
Warning: DOMDocument::loadHTML(): Unexpected end tag : div in Entity, line: 237 in /home/u552734802/domains/dailystocktopick.com/public_html/index.php on line 141
Warning: DOMDocument::loadHTML(): Unexpected end tag : li in Entity, line: 237 in /home/u552734802/domains/dailystocktopick.com/public_html/index.php on line 141
Warning: DOMDocument::loadHTML(): Unexpected end tag : div in Entity, line: 237 in /home/u552734802/domains/dailystocktopick.com/public_html/index.php on line 141
Warning: DOMDocument::loadHTML(): Unexpected end tag : a in Entity, line: 237 in /home/u552734802/domains/dailystocktopick.com/public_html/index.php on line 141
Warning: DOMDocument::loadHTML(): Unexpected end tag : a in Entity, line: 237 in /home/u552734802/domains/dailystocktopick.com/public_html/index.php on line 141
Warning: DOMDocument::loadHTML(): Unexpected end tag : a in Entity, line: 237 in /home/u552734802/domains/dailystocktopick.com/public_html/index.php on line 141
Warning: DOMDocument::loadHTML(): Unexpected end tag : a in Entity, line: 237 in /home/u552734802/domains/dailystocktopick.com/public_html/index.php on line 141
Warning: DOMDocument::loadHTML(): Unexpected end tag : a in Entity, line: 237 in /home/u552734802/domains/dailystocktopick.com/public_html/index.php on line 141
Warning: DOMDocument::loadHTML(): Unexpected end tag : a in Entity, line: 237 in /home/u552734802/domains/dailystocktopick.com/public_html/index.php on line 141
Warning: DOMDocument::loadHTML(): Unexpected end tag : a in Entity, line: 237 in /home/u552734802/domains/dailystocktopick.com/public_html/index.php on line 141
Warning: DOMDocument::loadHTML(): Unexpected end tag : a in Entity, line: 237 in /home/u552734802/domains/dailystocktopick.com/public_html/index.php on line 141
Warning: DOMDocument::loadHTML(): Unexpected end tag : a in Entity, line: 237 in /home/u552734802/domains/dailystocktopick.com/public_html/index.php on line 141
Warning: DOMDocument::loadHTML(): Unexpected end tag : a in Entity, line: 237 in /home/u552734802/domains/dailystocktopick.com/public_html/index.php on line 141
Warning: DOMDocument::loadHTML(): Unexpected end tag : a in Entity, line: 237 in /home/u552734802/domains/dailystocktopick.com/public_html/index.php on line 141
Warning: DOMDocument::loadHTML(): Unexpected end tag : a in Entity, line: 237 in /home/u552734802/domains/dailystocktopick.com/public_html/index.php on line 141
Warning: DOMDocument::loadHTML(): Unexpected end tag : a in Entity, line: 237 in /home/u552734802/domains/dailystocktopick.com/public_html/index.php on line 141
Warning: DOMDocument::loadHTML(): Unexpected end tag : a in Entity, line: 237 in /home/u552734802/domains/dailystocktopick.com/public_html/index.php on line 141
Warning: DOMDocument::loadHTML(): Unexpected end tag : a in Entity, line: 237 in /home/u552734802/domains/dailystocktopick.com/public_html/index.php on line 141
Warning: DOMDocument::loadHTML(): Unexpected end tag : a in Entity, line: 237 in /home/u552734802/domains/dailystocktopick.com/public_html/index.php on line 141
Warning: DOMDocument::loadHTML(): Unexpected end tag : a in Entity, line: 237 in /home/u552734802/domains/dailystocktopick.com/public_html/index.php on line 141
Warning: DOMDocument::loadHTML(): Unexpected end tag : a in Entity, line: 237 in /home/u552734802/domains/dailystocktopick.com/public_html/index.php on line 141
Warning: DOMDocument::loadHTML(): Unexpected end tag : div in Entity, line: 237 in /home/u552734802/domains/dailystocktopick.com/public_html/index.php on line 141
Warning: DOMDocument::loadHTML(): Unexpected end tag : li in Entity, line: 237 in /home/u552734802/domains/dailystocktopick.com/public_html/index.php on line 141
Warning: DOMDocument::loadHTML(): Unexpected end tag : div in Entity, line: 237 in /home/u552734802/domains/dailystocktopick.com/public_html/index.php on line 141
Warning: DOMDocument::loadHTML(): Unexpected end tag : a in Entity, line: 237 in /home/u552734802/domains/dailystocktopick.com/public_html/index.php on line 141
Warning: DOMDocument::loadHTML(): Unexpected end tag : a in Entity, line: 237 in /home/u552734802/domains/dailystocktopick.com/public_html/index.php on line 141
Warning: DOMDocument::loadHTML(): Unexpected end tag : a in Entity, line: 237 in /home/u552734802/domains/dailystocktopick.com/public_html/index.php on line 141
Warning: DOMDocument::loadHTML(): Unexpected end tag : a in Entity, line: 237 in /home/u552734802/domains/dailystocktopick.com/public_html/index.php on line 141
Warning: DOMDocument::loadHTML(): Unexpected end tag : a in Entity, line: 237 in /home/u552734802/domains/dailystocktopick.com/public_html/index.php on line 141
Warning: DOMDocument::loadHTML(): Unexpected end tag : a in Entity, line: 237 in /home/u552734802/domains/dailystocktopick.com/public_html/index.php on line 141
Warning: DOMDocument::loadHTML(): Unexpected end tag : a in Entity, line: 237 in /home/u552734802/domains/dailystocktopick.com/public_html/index.php on line 141
Warning: DOMDocument::loadHTML(): Unexpected end tag : a in Entity, line: 237 in /home/u552734802/domains/dailystocktopick.com/public_html/index.php on line 141
Warning: DOMDocument::loadHTML(): Unexpected end tag : a in Entity, line: 237 in /home/u552734802/domains/dailystocktopick.com/public_html/index.php on line 141
Warning: DOMDocument::loadHTML(): Unexpected end tag : a in Entity, line: 237 in /home/u552734802/domains/dailystocktopick.com/public_html/index.php on line 141
Warning: DOMDocument::loadHTML(): Unexpected end tag : a in Entity, line: 237 in /home/u552734802/domains/dailystocktopick.com/public_html/index.php on line 141
Warning: DOMDocument::loadHTML(): Unexpected end tag : a in Entity, line: 237 in /home/u552734802/domains/dailystocktopick.com/public_html/index.php on line 141
Warning: DOMDocument::loadHTML(): Unexpected end tag : a in Entity, line: 237 in /home/u552734802/domains/dailystocktopick.com/public_html/index.php on line 141
Warning: DOMDocument::loadHTML(): Unexpected end tag : a in Entity, line: 237 in /home/u552734802/domains/dailystocktopick.com/public_html/index.php on line 141
Warning: DOMDocument::loadHTML(): Unexpected end tag : a in Entity, line: 237 in /home/u552734802/domains/dailystocktopick.com/public_html/index.php on line 141
Warning: DOMDocument::loadHTML(): Unexpected end tag : div in Entity, line: 237 in /home/u552734802/domains/dailystocktopick.com/public_html/index.php on line 141
Warning: DOMDocument::loadHTML(): Unexpected end tag : li in Entity, line: 237 in /home/u552734802/domains/dailystocktopick.com/public_html/index.php on line 141
Warning: DOMDocument::loadHTML(): Unexpected end tag : div in Entity, line: 237 in /home/u552734802/domains/dailystocktopick.com/public_html/index.php on line 141
Warning: DOMDocument::loadHTML(): Unexpected end tag : a in Entity, line: 237 in /home/u552734802/domains/dailystocktopick.com/public_html/index.php on line 141
Warning: DOMDocument::loadHTML(): Unexpected end tag : a in Entity, line: 237 in /home/u552734802/domains/dailystocktopick.com/public_html/index.php on line 141
Warning: DOMDocument::loadHTML(): Unexpected end tag : a in Entity, line: 237 in /home/u552734802/domains/dailystocktopick.com/public_html/index.php on line 141
Warning: DOMDocument::loadHTML(): Unexpected end tag : a in Entity, line: 237 in /home/u552734802/domains/dailystocktopick.com/public_html/index.php on line 141
Warning: DOMDocument::loadHTML(): Unexpected end tag : a in Entity, line: 237 in /home/u552734802/domains/dailystocktopick.com/public_html/index.php on line 141
Warning: DOMDocument::loadHTML(): Unexpected end tag : a in Entity, line: 237 in /home/u552734802/domains/dailystocktopick.com/public_html/index.php on line 141
Warning: DOMDocument::loadHTML(): Unexpected end tag : a in Entity, line: 237 in /home/u552734802/domains/dailystocktopick.com/public_html/index.php on line 141
Warning: DOMDocument::loadHTML(): Unexpected end tag : a in Entity, line: 237 in /home/u552734802/domains/dailystocktopick.com/public_html/index.php on line 141
Warning: DOMDocument::loadHTML(): Unexpected end tag : a in Entity, line: 237 in /home/u552734802/domains/dailystocktopick.com/public_html/index.php on line 141
Warning: DOMDocument::loadHTML(): Unexpected end tag : a in Entity, line: 237 in /home/u552734802/domains/dailystocktopick.com/public_html/index.php on line 141
Warning: DOMDocument::loadHTML(): Unexpected end tag : a in Entity, line: 237 in /home/u552734802/domains/dailystocktopick.com/public_html/index.php on line 141
Warning: DOMDocument::loadHTML(): Unexpected end tag : a in Entity, line: 237 in /home/u552734802/domains/dailystocktopick.com/public_html/index.php on line 141
Warning: DOMDocument::loadHTML(): Unexpected end tag : a in Entity, line: 237 in /home/u552734802/domains/dailystocktopick.com/public_html/index.php on line 141
Warning: DOMDocument::loadHTML(): Unexpected end tag : div in Entity, line: 237 in /home/u552734802/domains/dailystocktopick.com/public_html/index.php on line 141
Warning: DOMDocument::loadHTML(): Unexpected end tag : li in Entity, line: 237 in /home/u552734802/domains/dailystocktopick.com/public_html/index.php on line 141
Warning: DOMDocument::loadHTML(): Unexpected end tag : div in Entity, line: 237 in /home/u552734802/domains/dailystocktopick.com/public_html/index.php on line 141
Warning: DOMDocument::loadHTML(): Unexpected end tag : a in Entity, line: 237 in /home/u552734802/domains/dailystocktopick.com/public_html/index.php on line 141
Warning: DOMDocument::loadHTML(): Unexpected end tag : a in Entity, line: 237 in /home/u552734802/domains/dailystocktopick.com/public_html/index.php on line 141
Warning: DOMDocument::loadHTML(): Unexpected end tag : a in Entity, line: 237 in /home/u552734802/domains/dailystocktopick.com/public_html/index.php on line 141
Warning: DOMDocument::loadHTML(): Unexpected end tag : a in Entity, line: 237 in /home/u552734802/domains/dailystocktopick.com/public_html/index.php on line 141
Warning: DOMDocument::loadHTML(): Unexpected end tag : a in Entity, line: 237 in /home/u552734802/domains/dailystocktopick.com/public_html/index.php on line 141
Warning: DOMDocument::loadHTML(): Unexpected end tag : a in Entity, line: 237 in /home/u552734802/domains/dailystocktopick.com/public_html/index.php on line 141
Warning: DOMDocument::loadHTML(): Unexpected end tag : a in Entity, line: 237 in /home/u552734802/domains/dailystocktopick.com/public_html/index.php on line 141
Warning: DOMDocument::loadHTML(): Unexpected end tag : a in Entity, line: 237 in /home/u552734802/domains/dailystocktopick.com/public_html/index.php on line 141
Warning: DOMDocument::loadHTML(): Unexpected end tag : a in Entity, line: 237 in /home/u552734802/domains/dailystocktopick.com/public_html/index.php on line 141
Warning: DOMDocument::loadHTML(): Unexpected end tag : a in Entity, line: 237 in /home/u552734802/domains/dailystocktopick.com/public_html/index.php on line 141
Warning: DOMDocument::loadHTML(): Unexpected end tag : a in Entity, line: 237 in /home/u552734802/domains/dailystocktopick.com/public_html/index.php on line 141
Warning: DOMDocument::loadHTML(): Unexpected end tag : a in Entity, line: 237 in /home/u552734802/domains/dailystocktopick.com/public_html/index.php on line 141
Warning: DOMDocument::loadHTML(): Unexpected end tag : a in Entity, line: 237 in /home/u552734802/domains/dailystocktopick.com/public_html/index.php on line 141
Warning: DOMDocument::loadHTML(): Unexpected end tag : a in Entity, line: 237 in /home/u552734802/domains/dailystocktopick.com/public_html/index.php on line 141
Warning: DOMDocument::loadHTML(): Unexpected end tag : a in Entity, line: 237 in /home/u552734802/domains/dailystocktopick.com/public_html/index.php on line 141
Warning: DOMDocument::loadHTML(): Unexpected end tag : a in Entity, line: 237 in /home/u552734802/domains/dailystocktopick.com/public_html/index.php on line 141
Warning: DOMDocument::loadHTML(): Unexpected end tag : div in Entity, line: 237 in /home/u552734802/domains/dailystocktopick.com/public_html/index.php on line 141
Warning: DOMDocument::loadHTML(): Unexpected end tag : li in Entity, line: 237 in /home/u552734802/domains/dailystocktopick.com/public_html/index.php on line 141
Warning: DOMDocument::loadHTML(): Unexpected end tag : div in Entity, line: 237 in /home/u552734802/domains/dailystocktopick.com/public_html/index.php on line 141
Warning: DOMDocument::loadHTML(): Unexpected end tag : a in Entity, line: 237 in /home/u552734802/domains/dailystocktopick.com/public_html/index.php on line 141
Warning: DOMDocument::loadHTML(): Unexpected end tag : a in Entity, line: 237 in /home/u552734802/domains/dailystocktopick.com/public_html/index.php on line 141
Warning: DOMDocument::loadHTML(): Unexpected end tag : a in Entity, line: 237 in /home/u552734802/domains/dailystocktopick.com/public_html/index.php on line 141
Warning: DOMDocument::loadHTML(): Unexpected end tag : a in Entity, line: 237 in /home/u552734802/domains/dailystocktopick.com/public_html/index.php on line 141
Warning: DOMDocument::loadHTML(): Unexpected end tag : a in Entity, line: 237 in /home/u552734802/domains/dailystocktopick.com/public_html/index.php on line 141
Warning: DOMDocument::loadHTML(): Unexpected end tag : a in Entity, line: 237 in /home/u552734802/domains/dailystocktopick.com/public_html/index.php on line 141
Warning: DOMDocument::loadHTML(): Unexpected end tag : a in Entity, line: 237 in /home/u552734802/domains/dailystocktopick.com/public_html/index.php on line 141
Warning: DOMDocument::loadHTML(): Unexpected end tag : a in Entity, line: 237 in /home/u552734802/domains/dailystocktopick.com/public_html/index.php on line 141
Warning: DOMDocument::loadHTML(): Unexpected end tag : a in Entity, line: 237 in /home/u552734802/domains/dailystocktopick.com/public_html/index.php on line 141
Warning: DOMDocument::loadHTML(): Unexpected end tag : a in Entity, line: 237 in /home/u552734802/domains/dailystocktopick.com/public_html/index.php on line 141
Warning: DOMDocument::loadHTML(): Unexpected end tag : a in Entity, line: 237 in /home/u552734802/domains/dailystocktopick.com/public_html/index.php on line 141
Warning: DOMDocument::loadHTML(): Unexpected end tag : a in Entity, line: 237 in /home/u552734802/domains/dailystocktopick.com/public_html/index.php on line 141
Warning: DOMDocument::loadHTML(): Unexpected end tag : a in Entity, line: 237 in /home/u552734802/domains/dailystocktopick.com/public_html/index.php on line 141
Warning: DOMDocument::loadHTML(): Unexpected end tag : a in Entity, line: 237 in /home/u552734802/domains/dailystocktopick.com/public_html/index.php on line 141
Warning: DOMDocument::loadHTML(): Unexpected end tag : a in Entity, line: 237 in /home/u552734802/domains/dailystocktopick.com/public_html/index.php on line 141
Warning: DOMDocument::loadHTML(): Unexpected end tag : a in Entity, line: 237 in /home/u552734802/domains/dailystocktopick.com/public_html/index.php on line 141
Warning: DOMDocument::loadHTML(): Unexpected end tag : div in Entity, line: 237 in /home/u552734802/domains/dailystocktopick.com/public_html/index.php on line 141
Warning: DOMDocument::loadHTML(): Unexpected end tag : li in Entity, line: 237 in /home/u552734802/domains/dailystocktopick.com/public_html/index.php on line 141
Warning: DOMDocument::loadHTML(): Unexpected end tag : div in Entity, line: 237 in /home/u552734802/domains/dailystocktopick.com/public_html/index.php on line 141
Warning: DOMDocument::loadHTML(): Unexpected end tag : a in Entity, line: 237 in /home/u552734802/domains/dailystocktopick.com/public_html/index.php on line 141
Warning: DOMDocument::loadHTML(): Unexpected end tag : a in Entity, line: 237 in /home/u552734802/domains/dailystocktopick.com/public_html/index.php on line 141
Warning: DOMDocument::loadHTML(): Unexpected end tag : a in Entity, line: 237 in /home/u552734802/domains/dailystocktopick.com/public_html/index.php on line 141
Warning: DOMDocument::loadHTML(): Unexpected end tag : a in Entity, line: 237 in /home/u552734802/domains/dailystocktopick.com/public_html/index.php on line 141
Warning: DOMDocument::loadHTML(): Unexpected end tag : a in Entity, line: 237 in /home/u552734802/domains/dailystocktopick.com/public_html/index.php on line 141
Warning: DOMDocument::loadHTML(): Unexpected end tag : a in Entity, line: 237 in /home/u552734802/domains/dailystocktopick.com/public_html/index.php on line 141
Warning: DOMDocument::loadHTML(): Unexpected end tag : a in Entity, line: 237 in /home/u552734802/domains/dailystocktopick.com/public_html/index.php on line 141
Warning: DOMDocument::loadHTML(): Unexpected end tag : a in Entity, line: 237 in /home/u552734802/domains/dailystocktopick.com/public_html/index.php on line 141
Warning: DOMDocument::loadHTML(): Unexpected end tag : a in Entity, line: 237 in /home/u552734802/domains/dailystocktopick.com/public_html/index.php on line 141
Warning: DOMDocument::loadHTML(): Unexpected end tag : a in Entity, line: 237 in /home/u552734802/domains/dailystocktopick.com/public_html/index.php on line 141
Warning: DOMDocument::loadHTML(): Unexpected end tag : a in Entity, line: 237 in /home/u552734802/domains/dailystocktopick.com/public_html/index.php on line 141
Warning: DOMDocument::loadHTML(): Unexpected end tag : a in Entity, line: 237 in /home/u552734802/domains/dailystocktopick.com/public_html/index.php on line 141
Warning: DOMDocument::loadHTML(): Unexpected end tag : a in Entity, line: 237 in /home/u552734802/domains/dailystocktopick.com/public_html/index.php on line 141
Warning: DOMDocument::loadHTML(): Unexpected end tag : a in Entity, line: 237 in /home/u552734802/domains/dailystocktopick.com/public_html/index.php on line 141
Warning: DOMDocument::loadHTML(): Unexpected end tag : a in Entity, line: 237 in /home/u552734802/domains/dailystocktopick.com/public_html/index.php on line 141
Warning: DOMDocument::loadHTML(): Unexpected end tag : a in Entity, line: 237 in /home/u552734802/domains/dailystocktopick.com/public_html/index.php on line 141
Warning: DOMDocument::loadHTML(): Unexpected end tag : a in Entity, line: 237 in /home/u552734802/domains/dailystocktopick.com/public_html/index.php on line 141
Warning: DOMDocument::loadHTML(): Unexpected end tag : a in Entity, line: 237 in /home/u552734802/domains/dailystocktopick.com/public_html/index.php on line 141
Warning: DOMDocument::loadHTML(): Unexpected end tag : div in Entity, line: 237 in /home/u552734802/domains/dailystocktopick.com/public_html/index.php on line 141
Warning: DOMDocument::loadHTML(): Unexpected end tag : li in Entity, line: 237 in /home/u552734802/domains/dailystocktopick.com/public_html/index.php on line 141
Warning: DOMDocument::loadHTML(): Unexpected end tag : div in Entity, line: 237 in /home/u552734802/domains/dailystocktopick.com/public_html/index.php on line 141
Warning: DOMDocument::loadHTML(): Unexpected end tag : a in Entity, line: 237 in /home/u552734802/domains/dailystocktopick.com/public_html/index.php on line 141
Warning: DOMDocument::loadHTML(): Unexpected end tag : a in Entity, line: 237 in /home/u552734802/domains/dailystocktopick.com/public_html/index.php on line 141
Warning: DOMDocument::loadHTML(): Unexpected end tag : a in Entity, line: 237 in /home/u552734802/domains/dailystocktopick.com/public_html/index.php on line 141
Warning: DOMDocument::loadHTML(): Unexpected end tag : a in Entity, line: 237 in /home/u552734802/domains/dailystocktopick.com/public_html/index.php on line 141
Warning: DOMDocument::loadHTML(): Unexpected end tag : a in Entity, line: 237 in /home/u552734802/domains/dailystocktopick.com/public_html/index.php on line 141
Warning: DOMDocument::loadHTML(): Unexpected end tag : a in Entity, line: 237 in /home/u552734802/domains/dailystocktopick.com/public_html/index.php on line 141
Warning: DOMDocument::loadHTML(): Unexpected end tag : a in Entity, line: 237 in /home/u552734802/domains/dailystocktopick.com/public_html/index.php on line 141
Warning: DOMDocument::loadHTML(): Unexpected end tag : a in Entity, line: 237 in /home/u552734802/domains/dailystocktopick.com/public_html/index.php on line 141
Warning: DOMDocument::loadHTML(): Unexpected end tag : a in Entity, line: 237 in /home/u552734802/domains/dailystocktopick.com/public_html/index.php on line 141
Warning: DOMDocument::loadHTML(): Unexpected end tag : a in Entity, line: 237 in /home/u552734802/domains/dailystocktopick.com/public_html/index.php on line 141
Warning: DOMDocument::loadHTML(): Unexpected end tag : div in Entity, line: 237 in /home/u552734802/domains/dailystocktopick.com/public_html/index.php on line 141
Warning: DOMDocument::loadHTML(): Unexpected end tag : li in Entity, line: 237 in /home/u552734802/domains/dailystocktopick.com/public_html/index.php on line 141
Warning: DOMDocument::loadHTML(): Unexpected end tag : div in Entity, line: 237 in /home/u552734802/domains/dailystocktopick.com/public_html/index.php on line 141
Warning: DOMDocument::loadHTML(): Unexpected end tag : a in Entity, line: 237 in /home/u552734802/domains/dailystocktopick.com/public_html/index.php on line 141
Warning: DOMDocument::loadHTML(): Unexpected end tag : a in Entity, line: 237 in /home/u552734802/domains/dailystocktopick.com/public_html/index.php on line 141
Warning: DOMDocument::loadHTML(): Unexpected end tag : a in Entity, line: 237 in /home/u552734802/domains/dailystocktopick.com/public_html/index.php on line 141
Warning: DOMDocument::loadHTML(): Unexpected end tag : a in Entity, line: 237 in /home/u552734802/domains/dailystocktopick.com/public_html/index.php on line 141
Warning: DOMDocument::loadHTML(): Unexpected end tag : a in Entity, line: 237 in /home/u552734802/domains/dailystocktopick.com/public_html/index.php on line 141
Warning: DOMDocument::loadHTML(): Unexpected end tag : a in Entity, line: 237 in /home/u552734802/domains/dailystocktopick.com/public_html/index.php on line 141
Warning: DOMDocument::loadHTML(): Unexpected end tag : a in Entity, line: 237 in /home/u552734802/domains/dailystocktopick.com/public_html/index.php on line 141
Warning: DOMDocument::loadHTML(): Unexpected end tag : a in Entity, line: 237 in /home/u552734802/domains/dailystocktopick.com/public_html/index.php on line 141
Warning: DOMDocument::loadHTML(): Unexpected end tag : a in Entity, line: 237 in /home/u552734802/domains/dailystocktopick.com/public_html/index.php on line 141
Warning: DOMDocument::loadHTML(): Unexpected end tag : a in Entity, line: 237 in /home/u552734802/domains/dailystocktopick.com/public_html/index.php on line 141
Warning: DOMDocument::loadHTML(): Unexpected end tag : div in Entity, line: 237 in /home/u552734802/domains/dailystocktopick.com/public_html/index.php on line 141
Warning: DOMDocument::loadHTML(): Unexpected end tag : li in Entity, line: 237 in /home/u552734802/domains/dailystocktopick.com/public_html/index.php on line 141
Warning: DOMDocument::loadHTML(): Unexpected end tag : div in Entity, line: 237 in /home/u552734802/domains/dailystocktopick.com/public_html/index.php on line 141
Warning: DOMDocument::loadHTML(): Unexpected end tag : a in Entity, line: 237 in /home/u552734802/domains/dailystocktopick.com/public_html/index.php on line 141
Warning: DOMDocument::loadHTML(): Unexpected end tag : a in Entity, line: 237 in /home/u552734802/domains/dailystocktopick.com/public_html/index.php on line 141
Warning: DOMDocument::loadHTML(): Unexpected end tag : a in Entity, line: 237 in /home/u552734802/domains/dailystocktopick.com/public_html/index.php on line 141
Warning: DOMDocument::loadHTML(): Unexpected end tag : a in Entity, line: 237 in /home/u552734802/domains/dailystocktopick.com/public_html/index.php on line 141
Warning: DOMDocument::loadHTML(): Unexpected end tag : a in Entity, line: 237 in /home/u552734802/domains/dailystocktopick.com/public_html/index.php on line 141
Warning: DOMDocument::loadHTML(): Unexpected end tag : a in Entity, line: 237 in /home/u552734802/domains/dailystocktopick.com/public_html/index.php on line 141
Warning: DOMDocument::loadHTML(): Unexpected end tag : a in Entity, line: 237 in /home/u552734802/domains/dailystocktopick.com/public_html/index.php on line 141
Warning: DOMDocument::loadHTML(): Unexpected end tag : a in Entity, line: 237 in /home/u552734802/domains/dailystocktopick.com/public_html/index.php on line 141
Warning: DOMDocument::loadHTML(): Unexpected end tag : a in Entity, line: 237 in /home/u552734802/domains/dailystocktopick.com/public_html/index.php on line 141
Warning: DOMDocument::loadHTML(): Unexpected end tag : a in Entity, line: 237 in /home/u552734802/domains/dailystocktopick.com/public_html/index.php on line 141
Warning: DOMDocument::loadHTML(): Unexpected end tag : a in Entity, line: 237 in /home/u552734802/domains/dailystocktopick.com/public_html/index.php on line 141
Warning: DOMDocument::loadHTML(): Unexpected end tag : div in Entity, line: 237 in /home/u552734802/domains/dailystocktopick.com/public_html/index.php on line 141
Warning: DOMDocument::loadHTML(): Unexpected end tag : li in Entity, line: 237 in /home/u552734802/domains/dailystocktopick.com/public_html/index.php on line 141
Warning: DOMDocument::loadHTML(): Unexpected end tag : div in Entity, line: 237 in /home/u552734802/domains/dailystocktopick.com/public_html/index.php on line 141
Warning: DOMDocument::loadHTML(): Unexpected end tag : a in Entity, line: 237 in /home/u552734802/domains/dailystocktopick.com/public_html/index.php on line 141
Warning: DOMDocument::loadHTML(): Unexpected end tag : a in Entity, line: 237 in /home/u552734802/domains/dailystocktopick.com/public_html/index.php on line 141
Warning: DOMDocument::loadHTML(): Unexpected end tag : a in Entity, line: 237 in /home/u552734802/domains/dailystocktopick.com/public_html/index.php on line 141
Warning: DOMDocument::loadHTML(): Unexpected end tag : a in Entity, line: 237 in /home/u552734802/domains/dailystocktopick.com/public_html/index.php on line 141
Warning: DOMDocument::loadHTML(): Unexpected end tag : a in Entity, line: 237 in /home/u552734802/domains/dailystocktopick.com/public_html/index.php on line 141
Warning: DOMDocument::loadHTML(): Unexpected end tag : a in Entity, line: 237 in /home/u552734802/domains/dailystocktopick.com/public_html/index.php on line 141
Warning: DOMDocument::loadHTML(): Unexpected end tag : a in Entity, line: 237 in /home/u552734802/domains/dailystocktopick.com/public_html/index.php on line 141
Warning: DOMDocument::loadHTML(): Unexpected end tag : a in Entity, line: 237 in /home/u552734802/domains/dailystocktopick.com/public_html/index.php on line 141
Warning: DOMDocument::loadHTML(): Unexpected end tag : a in Entity, line: 237 in /home/u552734802/domains/dailystocktopick.com/public_html/index.php on line 141
Warning: DOMDocument::loadHTML(): Unexpected end tag : a in Entity, line: 237 in /home/u552734802/domains/dailystocktopick.com/public_html/index.php on line 141
Warning: DOMDocument::loadHTML(): Unexpected end tag : a in Entity, line: 237 in /home/u552734802/domains/dailystocktopick.com/public_html/index.php on line 141
Warning: DOMDocument::loadHTML(): Unexpected end tag : a in Entity, line: 237 in /home/u552734802/domains/dailystocktopick.com/public_html/index.php on line 141
Warning: DOMDocument::loadHTML(): Unexpected end tag : a in Entity, line: 237 in /home/u552734802/domains/dailystocktopick.com/public_html/index.php on line 141
Warning: DOMDocument::loadHTML(): Unexpected end tag : a in Entity, line: 237 in /home/u552734802/domains/dailystocktopick.com/public_html/index.php on line 141
Warning: DOMDocument::loadHTML(): Unexpected end tag : a in Entity, line: 237 in /home/u552734802/domains/dailystocktopick.com/public_html/index.php on line 141
Warning: DOMDocument::loadHTML(): Unexpected end tag : a in Entity, line: 237 in /home/u552734802/domains/dailystocktopick.com/public_html/index.php on line 141
Warning: DOMDocument::loadHTML(): Unexpected end tag : a in Entity, line: 237 in /home/u552734802/domains/dailystocktopick.com/public_html/index.php on line 141
Warning: DOMDocument::loadHTML(): Unexpected end tag : div in Entity, line: 237 in /home/u552734802/domains/dailystocktopick.com/public_html/index.php on line 141
Warning: DOMDocument::loadHTML(): Unexpected end tag : li in Entity, line: 237 in /home/u552734802/domains/dailystocktopick.com/public_html/index.php on line 141
Warning: DOMDocument::loadHTML(): Unexpected end tag : div in Entity, line: 237 in /home/u552734802/domains/dailystocktopick.com/public_html/index.php on line 141
Warning: DOMDocument::loadHTML(): Unexpected end tag : a in Entity, line: 237 in /home/u552734802/domains/dailystocktopick.com/public_html/index.php on line 141
Warning: DOMDocument::loadHTML(): Unexpected end tag : a in Entity, line: 237 in /home/u552734802/domains/dailystocktopick.com/public_html/index.php on line 141
Warning: DOMDocument::loadHTML(): Unexpected end tag : a in Entity, line: 237 in /home/u552734802/domains/dailystocktopick.com/public_html/index.php on line 141
Warning: DOMDocument::loadHTML(): Unexpected end tag : a in Entity, line: 237 in /home/u552734802/domains/dailystocktopick.com/public_html/index.php on line 141
Warning: DOMDocument::loadHTML(): Unexpected end tag : a in Entity, line: 237 in /home/u552734802/domains/dailystocktopick.com/public_html/index.php on line 141
Warning: DOMDocument::loadHTML(): Unexpected end tag : a in Entity, line: 237 in /home/u552734802/domains/dailystocktopick.com/public_html/index.php on line 141
Warning: DOMDocument::loadHTML(): Unexpected end tag : a in Entity, line: 237 in /home/u552734802/domains/dailystocktopick.com/public_html/index.php on line 141
Warning: DOMDocument::loadHTML(): Unexpected end tag : a in Entity, line: 237 in /home/u552734802/domains/dailystocktopick.com/public_html/index.php on line 141
Warning: DOMDocument::loadHTML(): Unexpected end tag : a in Entity, line: 237 in /home/u552734802/domains/dailystocktopick.com/public_html/index.php on line 141
Warning: DOMDocument::loadHTML(): Unexpected end tag : a in Entity, line: 237 in /home/u552734802/domains/dailystocktopick.com/public_html/index.php on line 141
Warning: DOMDocument::loadHTML(): Unexpected end tag : a in Entity, line: 237 in /home/u552734802/domains/dailystocktopick.com/public_html/index.php on line 141
Warning: DOMDocument::loadHTML(): Unexpected end tag : a in Entity, line: 237 in /home/u552734802/domains/dailystocktopick.com/public_html/index.php on line 141
Warning: DOMDocument::loadHTML(): Unexpected end tag : a in Entity, line: 237 in /home/u552734802/domains/dailystocktopick.com/public_html/index.php on line 141
Warning: DOMDocument::loadHTML(): Unexpected end tag : div in Entity, line: 237 in /home/u552734802/domains/dailystocktopick.com/public_html/index.php on line 141
Warning: DOMDocument::loadHTML(): Unexpected end tag : li in Entity, line: 237 in /home/u552734802/domains/dailystocktopick.com/public_html/index.php on line 141
Warning: DOMDocument::loadHTML(): Unexpected end tag : div in Entity, line: 237 in /home/u552734802/domains/dailystocktopick.com/public_html/index.php on line 141
Warning: DOMDocument::loadHTML(): Unexpected end tag : a in Entity, line: 237 in /home/u552734802/domains/dailystocktopick.com/public_html/index.php on line 141
Warning: DOMDocument::loadHTML(): Unexpected end tag : a in Entity, line: 237 in /home/u552734802/domains/dailystocktopick.com/public_html/index.php on line 141
Warning: DOMDocument::loadHTML(): Unexpected end tag : a in Entity, line: 237 in /home/u552734802/domains/dailystocktopick.com/public_html/index.php on line 141
Warning: DOMDocument::loadHTML(): Unexpected end tag : a in Entity, line: 237 in /home/u552734802/domains/dailystocktopick.com/public_html/index.php on line 141
Warning: DOMDocument::loadHTML(): Unexpected end tag : a in Entity, line: 237 in /home/u552734802/domains/dailystocktopick.com/public_html/index.php on line 141
Warning: DOMDocument::loadHTML(): Unexpected end tag : a in Entity, line: 237 in /home/u552734802/domains/dailystocktopick.com/public_html/index.php on line 141
Warning: DOMDocument::loadHTML(): Unexpected end tag : a in Entity, line: 237 in /home/u552734802/domains/dailystocktopick.com/public_html/index.php on line 141
Warning: DOMDocument::loadHTML(): Unexpected end tag : a in Entity, line: 237 in /home/u552734802/domains/dailystocktopick.com/public_html/index.php on line 141
Warning: DOMDocument::loadHTML(): Unexpected end tag : a in Entity, line: 237 in /home/u552734802/domains/dailystocktopick.com/public_html/index.php on line 141
Warning: DOMDocument::loadHTML(): Unexpected end tag : a in Entity, line: 237 in /home/u552734802/domains/dailystocktopick.com/public_html/index.php on line 141
Warning: DOMDocument::loadHTML(): Unexpected end tag : a in Entity, line: 237 in /home/u552734802/domains/dailystocktopick.com/public_html/index.php on line 141
Warning: DOMDocument::loadHTML(): Unexpected end tag : a in Entity, line: 237 in /home/u552734802/domains/dailystocktopick.com/public_html/index.php on line 141
Warning: DOMDocument::loadHTML(): Unexpected end tag : a in Entity, line: 237 in /home/u552734802/domains/dailystocktopick.com/public_html/index.php on line 141
Warning: DOMDocument::loadHTML(): Unexpected end tag : a in Entity, line: 237 in /home/u552734802/domains/dailystocktopick.com/public_html/index.php on line 141
Warning: DOMDocument::loadHTML(): Unexpected end tag : a in Entity, line: 237 in /home/u552734802/domains/dailystocktopick.com/public_html/index.php on line 141
Warning: DOMDocument::loadHTML(): Unexpected end tag : div in Entity, line: 237 in /home/u552734802/domains/dailystocktopick.com/public_html/index.php on line 141
Warning: DOMDocument::loadHTML(): Unexpected end tag : li in Entity, line: 237 in /home/u552734802/domains/dailystocktopick.com/public_html/index.php on line 141
Warning: DOMDocument::loadHTML(): Unexpected end tag : div in Entity, line: 237 in /home/u552734802/domains/dailystocktopick.com/public_html/index.php on line 141
Warning: DOMDocument::loadHTML(): Unexpected end tag : a in Entity, line: 237 in /home/u552734802/domains/dailystocktopick.com/public_html/index.php on line 141
Warning: DOMDocument::loadHTML(): Unexpected end tag : a in Entity, line: 237 in /home/u552734802/domains/dailystocktopick.com/public_html/index.php on line 141
Warning: DOMDocument::loadHTML(): Unexpected end tag : a in Entity, line: 237 in /home/u552734802/domains/dailystocktopick.com/public_html/index.php on line 141
Warning: DOMDocument::loadHTML(): Unexpected end tag : a in Entity, line: 237 in /home/u552734802/domains/dailystocktopick.com/public_html/index.php on line 141
Warning: DOMDocument::loadHTML(): Unexpected end tag : a in Entity, line: 237 in /home/u552734802/domains/dailystocktopick.com/public_html/index.php on line 141
Warning: DOMDocument::loadHTML(): Unexpected end tag : a in Entity, line: 237 in /home/u552734802/domains/dailystocktopick.com/public_html/index.php on line 141
Warning: DOMDocument::loadHTML(): Unexpected end tag : a in Entity, line: 237 in /home/u552734802/domains/dailystocktopick.com/public_html/index.php on line 141
Warning: DOMDocument::loadHTML(): Unexpected end tag : a in Entity, line: 237 in /home/u552734802/domains/dailystocktopick.com/public_html/index.php on line 141
Warning: DOMDocument::loadHTML(): Unexpected end tag : a in Entity, line: 237 in /home/u552734802/domains/dailystocktopick.com/public_html/index.php on line 141
Warning: DOMDocument::loadHTML(): Unexpected end tag : a in Entity, line: 237 in /home/u552734802/domains/dailystocktopick.com/public_html/index.php on line 141
Warning: DOMDocument::loadHTML(): Unexpected end tag : div in Entity, line: 237 in /home/u552734802/domains/dailystocktopick.com/public_html/index.php on line 141
Warning: DOMDocument::loadHTML(): Unexpected end tag : li in Entity, line: 237 in /home/u552734802/domains/dailystocktopick.com/public_html/index.php on line 141
Warning: DOMDocument::loadHTML(): Unexpected end tag : div in Entity, line: 237 in /home/u552734802/domains/dailystocktopick.com/public_html/index.php on line 141
Warning: DOMDocument::loadHTML(): Unexpected end tag : a in Entity, line: 237 in /home/u552734802/domains/dailystocktopick.com/public_html/index.php on line 141
Warning: DOMDocument::loadHTML(): Unexpected end tag : a in Entity, line: 237 in /home/u552734802/domains/dailystocktopick.com/public_html/index.php on line 141
Warning: DOMDocument::loadHTML(): Unexpected end tag : a in Entity, line: 237 in /home/u552734802/domains/dailystocktopick.com/public_html/index.php on line 141
Warning: DOMDocument::loadHTML(): Unexpected end tag : a in Entity, line: 237 in /home/u552734802/domains/dailystocktopick.com/public_html/index.php on line 141
Warning: DOMDocument::loadHTML(): Unexpected end tag : a in Entity, line: 237 in /home/u552734802/domains/dailystocktopick.com/public_html/index.php on line 141
Warning: DOMDocument::loadHTML(): Unexpected end tag : a in Entity, line: 237 in /home/u552734802/domains/dailystocktopick.com/public_html/index.php on line 141
Warning: DOMDocument::loadHTML(): Unexpected end tag : a in Entity, line: 237 in /home/u552734802/domains/dailystocktopick.com/public_html/index.php on line 141
Warning: DOMDocument::loadHTML(): Unexpected end tag : a in Entity, line: 237 in /home/u552734802/domains/dailystocktopick.com/public_html/index.php on line 141
Warning: DOMDocument::loadHTML(): Unexpected end tag : a in Entity, line: 237 in /home/u552734802/domains/dailystocktopick.com/public_html/index.php on line 141
Warning: DOMDocument::loadHTML(): Unexpected end tag : a in Entity, line: 237 in /home/u552734802/domains/dailystocktopick.com/public_html/index.php on line 141
Warning: DOMDocument::loadHTML(): Unexpected end tag : a in Entity, line: 237 in /home/u552734802/domains/dailystocktopick.com/public_html/index.php on line 141
Warning: DOMDocument::loadHTML(): Unexpected end tag : a in Entity, line: 237 in /home/u552734802/domains/dailystocktopick.com/public_html/index.php on line 141
Warning: DOMDocument::loadHTML(): Unexpected end tag : a in Entity, line: 237 in /home/u552734802/domains/dailystocktopick.com/public_html/index.php on line 141
Warning: DOMDocument::loadHTML(): Unexpected end tag : a in Entity, line: 237 in /home/u552734802/domains/dailystocktopick.com/public_html/index.php on line 141
Warning: DOMDocument::loadHTML(): Unexpected end tag : a in Entity, line: 237 in /home/u552734802/domains/dailystocktopick.com/public_html/index.php on line 141
Warning: DOMDocument::loadHTML(): Unexpected end tag : a in Entity, line: 237 in /home/u552734802/domains/dailystocktopick.com/public_html/index.php on line 141
Warning: DOMDocument::loadHTML(): Unexpected end tag : a in Entity, line: 237 in /home/u552734802/domains/dailystocktopick.com/public_html/index.php on line 141
Warning: DOMDocument::loadHTML(): Unexpected end tag : a in Entity, line: 237 in /home/u552734802/domains/dailystocktopick.com/public_html/index.php on line 141
Warning: DOMDocument::loadHTML(): Unexpected end tag : a in Entity, line: 237 in /home/u552734802/domains/dailystocktopick.com/public_html/index.php on line 141
Warning: DOMDocument::loadHTML(): Unexpected end tag : div in Entity, line: 237 in /home/u552734802/domains/dailystocktopick.com/public_html/index.php on line 141
Warning: DOMDocument::loadHTML(): Unexpected end tag : li in Entity, line: 237 in /home/u552734802/domains/dailystocktopick.com/public_html/index.php on line 141
Warning: DOMDocument::loadHTML(): Unexpected end tag : div in Entity, line: 237 in /home/u552734802/domains/dailystocktopick.com/public_html/index.php on line 141
Warning: DOMDocument::loadHTML(): Unexpected end tag : a in Entity, line: 237 in /home/u552734802/domains/dailystocktopick.com/public_html/index.php on line 141
Warning: DOMDocument::loadHTML(): Unexpected end tag : a in Entity, line: 237 in /home/u552734802/domains/dailystocktopick.com/public_html/index.php on line 141
Warning: DOMDocument::loadHTML(): Unexpected end tag : a in Entity, line: 237 in /home/u552734802/domains/dailystocktopick.com/public_html/index.php on line 141
Warning: DOMDocument::loadHTML(): Unexpected end tag : a in Entity, line: 237 in /home/u552734802/domains/dailystocktopick.com/public_html/index.php on line 141
Warning: DOMDocument::loadHTML(): Unexpected end tag : a in Entity, line: 237 in /home/u552734802/domains/dailystocktopick.com/public_html/index.php on line 141
Warning: DOMDocument::loadHTML(): Unexpected end tag : a in Entity, line: 237 in /home/u552734802/domains/dailystocktopick.com/public_html/index.php on line 141
Warning: DOMDocument::loadHTML(): Unexpected end tag : a in Entity, line: 237 in /home/u552734802/domains/dailystocktopick.com/public_html/index.php on line 141
Warning: DOMDocument::loadHTML(): Unexpected end tag : a in Entity, line: 237 in /home/u552734802/domains/dailystocktopick.com/public_html/index.php on line 141
Warning: DOMDocument::loadHTML(): Unexpected end tag : a in Entity, line: 237 in /home/u552734802/domains/dailystocktopick.com/public_html/index.php on line 141
Warning: DOMDocument::loadHTML(): Unexpected end tag : a in Entity, line: 237 in /home/u552734802/domains/dailystocktopick.com/public_html/index.php on line 141
Warning: DOMDocument::loadHTML(): Unexpected end tag : a in Entity, line: 237 in /home/u552734802/domains/dailystocktopick.com/public_html/index.php on line 141
Warning: DOMDocument::loadHTML(): Unexpected end tag : a in Entity, line: 237 in /home/u552734802/domains/dailystocktopick.com/public_html/index.php on line 141
Warning: DOMDocument::loadHTML(): Unexpected end tag : a in Entity, line: 237 in /home/u552734802/domains/dailystocktopick.com/public_html/index.php on line 141
Warning: DOMDocument::loadHTML(): Unexpected end tag : div in Entity, line: 237 in /home/u552734802/domains/dailystocktopick.com/public_html/index.php on line 141
Warning: DOMDocument::loadHTML(): Unexpected end tag : li in Entity, line: 237 in /home/u552734802/domains/dailystocktopick.com/public_html/index.php on line 141
Warning: DOMDocument::loadHTML(): Unexpected end tag : div in Entity, line: 237 in /home/u552734802/domains/dailystocktopick.com/public_html/index.php on line 141
Warning: DOMDocument::loadHTML(): Unexpected end tag : a in Entity, line: 237 in /home/u552734802/domains/dailystocktopick.com/public_html/index.php on line 141
Warning: DOMDocument::loadHTML(): Unexpected end tag : a in Entity, line: 237 in /home/u552734802/domains/dailystocktopick.com/public_html/index.php on line 141
Warning: DOMDocument::loadHTML(): Unexpected end tag : a in Entity, line: 237 in /home/u552734802/domains/dailystocktopick.com/public_html/index.php on line 141
Warning: DOMDocument::loadHTML(): Unexpected end tag : a in Entity, line: 237 in /home/u552734802/domains/dailystocktopick.com/public_html/index.php on line 141
Warning: DOMDocument::loadHTML(): Unexpected end tag : a in Entity, line: 237 in /home/u552734802/domains/dailystocktopick.com/public_html/index.php on line 141
Warning: DOMDocument::loadHTML(): Unexpected end tag : a in Entity, line: 237 in /home/u552734802/domains/dailystocktopick.com/public_html/index.php on line 141
Warning: DOMDocument::loadHTML(): Unexpected end tag : a in Entity, line: 237 in /home/u552734802/domains/dailystocktopick.com/public_html/index.php on line 141
Warning: DOMDocument::loadHTML(): Unexpected end tag : a in Entity, line: 237 in /home/u552734802/domains/dailystocktopick.com/public_html/index.php on line 141
Warning: DOMDocument::loadHTML(): Unexpected end tag : div in Entity, line: 237 in /home/u552734802/domains/dailystocktopick.com/public_html/index.php on line 141
Warning: DOMDocument::loadHTML(): Unexpected end tag : li in Entity, line: 237 in /home/u552734802/domains/dailystocktopick.com/public_html/index.php on line 141
Warning: DOMDocument::loadHTML(): Unexpected end tag : div in Entity, line: 237 in /home/u552734802/domains/dailystocktopick.com/public_html/index.php on line 141
Warning: DOMDocument::loadHTML(): Unexpected end tag : a in Entity, line: 237 in /home/u552734802/domains/dailystocktopick.com/public_html/index.php on line 141
Warning: DOMDocument::loadHTML(): Unexpected end tag : a in Entity, line: 237 in /home/u552734802/domains/dailystocktopick.com/public_html/index.php on line 141
Warning: DOMDocument::loadHTML(): Unexpected end tag : a in Entity, line: 237 in /home/u552734802/domains/dailystocktopick.com/public_html/index.php on line 141
Warning: DOMDocument::loadHTML(): Unexpected end tag : a in Entity, line: 237 in /home/u552734802/domains/dailystocktopick.com/public_html/index.php on line 141
Warning: DOMDocument::loadHTML(): Unexpected end tag : a in Entity, line: 237 in /home/u552734802/domains/dailystocktopick.com/public_html/index.php on line 141
Warning: DOMDocument::loadHTML(): Unexpected end tag : a in Entity, line: 237 in /home/u552734802/domains/dailystocktopick.com/public_html/index.php on line 141
Warning: DOMDocument::loadHTML(): Unexpected end tag : a in Entity, line: 237 in /home/u552734802/domains/dailystocktopick.com/public_html/index.php on line 141
Warning: DOMDocument::loadHTML(): Unexpected end tag : a in Entity, line: 237 in /home/u552734802/domains/dailystocktopick.com/public_html/index.php on line 141
Warning: DOMDocument::loadHTML(): Unexpected end tag : a in Entity, line: 237 in /home/u552734802/domains/dailystocktopick.com/public_html/index.php on line 141
Warning: DOMDocument::loadHTML(): Unexpected end tag : a in Entity, line: 237 in /home/u552734802/domains/dailystocktopick.com/public_html/index.php on line 141
Warning: DOMDocument::loadHTML(): Unexpected end tag : a in Entity, line: 237 in /home/u552734802/domains/dailystocktopick.com/public_html/index.php on line 141
Warning: DOMDocument::loadHTML(): Unexpected end tag : a in Entity, line: 237 in /home/u552734802/domains/dailystocktopick.com/public_html/index.php on line 141
Warning: DOMDocument::loadHTML(): Unexpected end tag : a in Entity, line: 237 in /home/u552734802/domains/dailystocktopick.com/public_html/index.php on line 141
Warning: DOMDocument::loadHTML(): Unexpected end tag : a in Entity, line: 237 in /home/u552734802/domains/dailystocktopick.com/public_html/index.php on line 141
Warning: DOMDocument::loadHTML(): Unexpected end tag : a in Entity, line: 237 in /home/u552734802/domains/dailystocktopick.com/public_html/index.php on line 141
Warning: DOMDocument::loadHTML(): Unexpected end tag : a in Entity, line: 237 in /home/u552734802/domains/dailystocktopick.com/public_html/index.php on line 141
Warning: DOMDocument::loadHTML(): Unexpected end tag : div in Entity, line: 237 in /home/u552734802/domains/dailystocktopick.com/public_html/index.php on line 141
Warning: DOMDocument::loadHTML(): Unexpected end tag : li in Entity, line: 237 in /home/u552734802/domains/dailystocktopick.com/public_html/index.php on line 141
Warning: DOMDocument::loadHTML(): Unexpected end tag : div in Entity, line: 237 in /home/u552734802/domains/dailystocktopick.com/public_html/index.php on line 141
Warning: DOMDocument::loadHTML(): Unexpected end tag : a in Entity, line: 237 in /home/u552734802/domains/dailystocktopick.com/public_html/index.php on line 141
Warning: DOMDocument::loadHTML(): Unexpected end tag : a in Entity, line: 237 in /home/u552734802/domains/dailystocktopick.com/public_html/index.php on line 141
Warning: DOMDocument::loadHTML(): Unexpected end tag : a in Entity, line: 237 in /home/u552734802/domains/dailystocktopick.com/public_html/index.php on line 141
Warning: DOMDocument::loadHTML(): Unexpected end tag : a in Entity, line: 237 in /home/u552734802/domains/dailystocktopick.com/public_html/index.php on line 141
Warning: DOMDocument::loadHTML(): Unexpected end tag : a in Entity, line: 237 in /home/u552734802/domains/dailystocktopick.com/public_html/index.php on line 141
Warning: DOMDocument::loadHTML(): Unexpected end tag : a in Entity, line: 237 in /home/u552734802/domains/dailystocktopick.com/public_html/index.php on line 141
Warning: DOMDocument::loadHTML(): Unexpected end tag : a in Entity, line: 237 in /home/u552734802/domains/dailystocktopick.com/public_html/index.php on line 141
Warning: DOMDocument::loadHTML(): Unexpected end tag : a in Entity, line: 237 in /home/u552734802/domains/dailystocktopick.com/public_html/index.php on line 141
Warning: DOMDocument::loadHTML(): Unexpected end tag : a in Entity, line: 237 in /home/u552734802/domains/dailystocktopick.com/public_html/index.php on line 141
Warning: DOMDocument::loadHTML(): Unexpected end tag : a in Entity, line: 237 in /home/u552734802/domains/dailystocktopick.com/public_html/index.php on line 141
Warning: DOMDocument::loadHTML(): Unexpected end tag : a in Entity, line: 237 in /home/u552734802/domains/dailystocktopick.com/public_html/index.php on line 141
Warning: DOMDocument::loadHTML(): Unexpected end tag : a in Entity, line: 237 in /home/u552734802/domains/dailystocktopick.com/public_html/index.php on line 141
Warning: DOMDocument::loadHTML(): Unexpected end tag : a in Entity, line: 237 in /home/u552734802/domains/dailystocktopick.com/public_html/index.php on line 141
Warning: DOMDocument::loadHTML(): Unexpected end tag : a in Entity, line: 237 in /home/u552734802/domains/dailystocktopick.com/public_html/index.php on line 141
Warning: DOMDocument::loadHTML(): Unexpected end tag : a in Entity, line: 237 in /home/u552734802/domains/dailystocktopick.com/public_html/index.php on line 141
Warning: DOMDocument::loadHTML(): Unexpected end tag : div in Entity, line: 237 in /home/u552734802/domains/dailystocktopick.com/public_html/index.php on line 141
Warning: DOMDocument::loadHTML(): Unexpected end tag : li in Entity, line: 237 in /home/u552734802/domains/dailystocktopick.com/public_html/index.php on line 141
Warning: DOMDocument::loadHTML(): Unexpected end tag : div in Entity, line: 237 in /home/u552734802/domains/dailystocktopick.com/public_html/index.php on line 141
Warning: DOMDocument::loadHTML(): Unexpected end tag : a in Entity, line: 237 in /home/u552734802/domains/dailystocktopick.com/public_html/index.php on line 141
Warning: DOMDocument::loadHTML(): Unexpected end tag : a in Entity, line: 237 in /home/u552734802/domains/dailystocktopick.com/public_html/index.php on line 141
Warning: DOMDocument::loadHTML(): Unexpected end tag : a in Entity, line: 237 in /home/u552734802/domains/dailystocktopick.com/public_html/index.php on line 141
Warning: DOMDocument::loadHTML(): Unexpected end tag : a in Entity, line: 237 in /home/u552734802/domains/dailystocktopick.com/public_html/index.php on line 141
Warning: DOMDocument::loadHTML(): Unexpected end tag : a in Entity, line: 237 in /home/u552734802/domains/dailystocktopick.com/public_html/index.php on line 141
Warning: DOMDocument::loadHTML(): Unexpected end tag : a in Entity, line: 237 in /home/u552734802/domains/dailystocktopick.com/public_html/index.php on line 141
Warning: DOMDocument::loadHTML(): Unexpected end tag : a in Entity, line: 237 in /home/u552734802/domains/dailystocktopick.com/public_html/index.php on line 141
Warning: DOMDocument::loadHTML(): Unexpected end tag : a in Entity, line: 237 in /home/u552734802/domains/dailystocktopick.com/public_html/index.php on line 141
Warning: DOMDocument::loadHTML(): Unexpected end tag : a in Entity, line: 237 in /home/u552734802/domains/dailystocktopick.com/public_html/index.php on line 141
Warning: DOMDocument::loadHTML(): Unexpected end tag : a in Entity, line: 237 in /home/u552734802/domains/dailystocktopick.com/public_html/index.php on line 141
Warning: DOMDocument::loadHTML(): Unexpected end tag : a in Entity, line: 237 in /home/u552734802/domains/dailystocktopick.com/public_html/index.php on line 141
Warning: DOMDocument::loadHTML(): Unexpected end tag : a in Entity, line: 237 in /home/u552734802/domains/dailystocktopick.com/public_html/index.php on line 141
Warning: DOMDocument::loadHTML(): Unexpected end tag : a in Entity, line: 237 in /home/u552734802/domains/dailystocktopick.com/public_html/index.php on line 141
Warning: DOMDocument::loadHTML(): Unexpected end tag : a in Entity, line: 237 in /home/u552734802/domains/dailystocktopick.com/public_html/index.php on line 141
Warning: DOMDocument::loadHTML(): Unexpected end tag : a in Entity, line: 237 in /home/u552734802/domains/dailystocktopick.com/public_html/index.php on line 141
Warning: DOMDocument::loadHTML(): Unexpected end tag : a in Entity, line: 237 in /home/u552734802/domains/dailystocktopick.com/public_html/index.php on line 141
Warning: DOMDocument::loadHTML(): Unexpected end tag : a in Entity, line: 237 in /home/u552734802/domains/dailystocktopick.com/public_html/index.php on line 141
Warning: DOMDocument::loadHTML(): Unexpected end tag : div in Entity, line: 237 in /home/u552734802/domains/dailystocktopick.com/public_html/index.php on line 141
Warning: DOMDocument::loadHTML(): Unexpected end tag : li in Entity, line: 237 in /home/u552734802/domains/dailystocktopick.com/public_html/index.php on line 141
Warning: DOMDocument::loadHTML(): Unexpected end tag : div in Entity, line: 237 in /home/u552734802/domains/dailystocktopick.com/public_html/index.php on line 141
Warning: DOMDocument::loadHTML(): Unexpected end tag : a in Entity, line: 237 in /home/u552734802/domains/dailystocktopick.com/public_html/index.php on line 141
Warning: DOMDocument::loadHTML(): Unexpected end tag : a in Entity, line: 237 in /home/u552734802/domains/dailystocktopick.com/public_html/index.php on line 141
Warning: DOMDocument::loadHTML(): Unexpected end tag : a in Entity, line: 237 in /home/u552734802/domains/dailystocktopick.com/public_html/index.php on line 141
Warning: DOMDocument::loadHTML(): Unexpected end tag : a in Entity, line: 237 in /home/u552734802/domains/dailystocktopick.com/public_html/index.php on line 141
Warning: DOMDocument::loadHTML(): Unexpected end tag : a in Entity, line: 237 in /home/u552734802/domains/dailystocktopick.com/public_html/index.php on line 141
Warning: DOMDocument::loadHTML(): Unexpected end tag : a in Entity, line: 237 in /home/u552734802/domains/dailystocktopick.com/public_html/index.php on line 141
Warning: DOMDocument::loadHTML(): Unexpected end tag : a in Entity, line: 237 in /home/u552734802/domains/dailystocktopick.com/public_html/index.php on line 141
Warning: DOMDocument::loadHTML(): Unexpected end tag : a in Entity, line: 237 in /home/u552734802/domains/dailystocktopick.com/public_html/index.php on line 141
Warning: DOMDocument::loadHTML(): Unexpected end tag : a in Entity, line: 237 in /home/u552734802/domains/dailystocktopick.com/public_html/index.php on line 141
Warning: DOMDocument::loadHTML(): Unexpected end tag : a in Entity, line: 237 in /home/u552734802/domains/dailystocktopick.com/public_html/index.php on line 141
Warning: DOMDocument::loadHTML(): Unexpected end tag : a in Entity, line: 237 in /home/u552734802/domains/dailystocktopick.com/public_html/index.php on line 141
Warning: DOMDocument::loadHTML(): Unexpected end tag : a in Entity, line: 237 in /home/u552734802/domains/dailystocktopick.com/public_html/index.php on line 141
Warning: DOMDocument::loadHTML(): Unexpected end tag : a in Entity, line: 237 in /home/u552734802/domains/dailystocktopick.com/public_html/index.php on line 141
Warning: DOMDocument::loadHTML(): Unexpected end tag : div in Entity, line: 237 in /home/u552734802/domains/dailystocktopick.com/public_html/index.php on line 141
Warning: DOMDocument::loadHTML(): Unexpected end tag : li in Entity, line: 237 in /home/u552734802/domains/dailystocktopick.com/public_html/index.php on line 141
Warning: DOMDocument::loadHTML(): Unexpected end tag : ul in Entity, line: 237 in /home/u552734802/domains/dailystocktopick.com/public_html/index.php on line 141
Warning: DOMDocument::loadHTML(): Unexpected end tag : h2 in Entity, line: 252 in /home/u552734802/domains/dailystocktopick.com/public_html/index.php on line 141
Warning: DOMDocument::loadHTML(): Unexpected end tag : p in Entity, line: 253 in /home/u552734802/domains/dailystocktopick.com/public_html/index.php on line 141
Warning: DOMDocument::loadHTML(): Unexpected end tag : button in Entity, line: 256 in /home/u552734802/domains/dailystocktopick.com/public_html/index.php on line 141
Warning: DOMDocument::loadHTML(): Unexpected end tag : div in Entity, line: 257 in /home/u552734802/domains/dailystocktopick.com/public_html/index.php on line 141
| Automatic Data Processing Inc | |||
| Symbol: | ADP | Current: | 266.46 |
| Breakout: | 268.02 | Target: | 283.40 |
| Support: | 264.56 | Resist: | 0.00 |
| Volume: | 2.4mil shares -18.6% compared to typical volume of 3.0mil | ||
|
|
|||
Warning: DOMDocument::loadHTML(): Unexpected end tag : i in Entity, line: 237 in /home/u552734802/domains/dailystocktopick.com/public_html/index.php on line 141
Warning: DOMDocument::loadHTML(): Unexpected end tag : span in Entity, line: 237 in /home/u552734802/domains/dailystocktopick.com/public_html/index.php on line 141
Warning: DOMDocument::loadHTML(): Unexpected end tag : div in Entity, line: 237 in /home/u552734802/domains/dailystocktopick.com/public_html/index.php on line 141
Warning: DOMDocument::loadHTML(): Unexpected end tag : div in Entity, line: 237 in /home/u552734802/domains/dailystocktopick.com/public_html/index.php on line 141
Warning: DOMDocument::loadHTML(): Unexpected end tag : a in Entity, line: 237 in /home/u552734802/domains/dailystocktopick.com/public_html/index.php on line 141
Warning: DOMDocument::loadHTML(): Unexpected end tag : a in Entity, line: 237 in /home/u552734802/domains/dailystocktopick.com/public_html/index.php on line 141
Warning: DOMDocument::loadHTML(): Unexpected end tag : a in Entity, line: 237 in /home/u552734802/domains/dailystocktopick.com/public_html/index.php on line 141
Warning: DOMDocument::loadHTML(): Unexpected end tag : a in Entity, line: 237 in /home/u552734802/domains/dailystocktopick.com/public_html/index.php on line 141
Warning: DOMDocument::loadHTML(): Unexpected end tag : a in Entity, line: 237 in /home/u552734802/domains/dailystocktopick.com/public_html/index.php on line 141
Warning: DOMDocument::loadHTML(): Unexpected end tag : a in Entity, line: 237 in /home/u552734802/domains/dailystocktopick.com/public_html/index.php on line 141
Warning: DOMDocument::loadHTML(): Unexpected end tag : a in Entity, line: 237 in /home/u552734802/domains/dailystocktopick.com/public_html/index.php on line 141
Warning: DOMDocument::loadHTML(): Unexpected end tag : a in Entity, line: 237 in /home/u552734802/domains/dailystocktopick.com/public_html/index.php on line 141
Warning: DOMDocument::loadHTML(): Unexpected end tag : a in Entity, line: 237 in /home/u552734802/domains/dailystocktopick.com/public_html/index.php on line 141
Warning: DOMDocument::loadHTML(): Unexpected end tag : a in Entity, line: 237 in /home/u552734802/domains/dailystocktopick.com/public_html/index.php on line 141
Warning: DOMDocument::loadHTML(): Unexpected end tag : a in Entity, line: 237 in /home/u552734802/domains/dailystocktopick.com/public_html/index.php on line 141
Warning: DOMDocument::loadHTML(): Unexpected end tag : div in Entity, line: 237 in /home/u552734802/domains/dailystocktopick.com/public_html/index.php on line 141
Warning: DOMDocument::loadHTML(): Unexpected end tag : li in Entity, line: 237 in /home/u552734802/domains/dailystocktopick.com/public_html/index.php on line 141
Warning: DOMDocument::loadHTML(): Unexpected end tag : div in Entity, line: 237 in /home/u552734802/domains/dailystocktopick.com/public_html/index.php on line 141
Warning: DOMDocument::loadHTML(): Unexpected end tag : a in Entity, line: 237 in /home/u552734802/domains/dailystocktopick.com/public_html/index.php on line 141
Warning: DOMDocument::loadHTML(): Unexpected end tag : a in Entity, line: 237 in /home/u552734802/domains/dailystocktopick.com/public_html/index.php on line 141
Warning: DOMDocument::loadHTML(): Unexpected end tag : a in Entity, line: 237 in /home/u552734802/domains/dailystocktopick.com/public_html/index.php on line 141
Warning: DOMDocument::loadHTML(): Unexpected end tag : a in Entity, line: 237 in /home/u552734802/domains/dailystocktopick.com/public_html/index.php on line 141
Warning: DOMDocument::loadHTML(): Unexpected end tag : a in Entity, line: 237 in /home/u552734802/domains/dailystocktopick.com/public_html/index.php on line 141
Warning: DOMDocument::loadHTML(): Unexpected end tag : a in Entity, line: 237 in /home/u552734802/domains/dailystocktopick.com/public_html/index.php on line 141
Warning: DOMDocument::loadHTML(): Unexpected end tag : a in Entity, line: 237 in /home/u552734802/domains/dailystocktopick.com/public_html/index.php on line 141
Warning: DOMDocument::loadHTML(): Unexpected end tag : a in Entity, line: 237 in /home/u552734802/domains/dailystocktopick.com/public_html/index.php on line 141
Warning: DOMDocument::loadHTML(): Unexpected end tag : a in Entity, line: 237 in /home/u552734802/domains/dailystocktopick.com/public_html/index.php on line 141
Warning: DOMDocument::loadHTML(): Unexpected end tag : a in Entity, line: 237 in /home/u552734802/domains/dailystocktopick.com/public_html/index.php on line 141
Warning: DOMDocument::loadHTML(): Unexpected end tag : a in Entity, line: 237 in /home/u552734802/domains/dailystocktopick.com/public_html/index.php on line 141
Warning: DOMDocument::loadHTML(): Unexpected end tag : a in Entity, line: 237 in /home/u552734802/domains/dailystocktopick.com/public_html/index.php on line 141
Warning: DOMDocument::loadHTML(): Unexpected end tag : div in Entity, line: 237 in /home/u552734802/domains/dailystocktopick.com/public_html/index.php on line 141
Warning: DOMDocument::loadHTML(): Unexpected end tag : li in Entity, line: 237 in /home/u552734802/domains/dailystocktopick.com/public_html/index.php on line 141
Warning: DOMDocument::loadHTML(): Unexpected end tag : div in Entity, line: 237 in /home/u552734802/domains/dailystocktopick.com/public_html/index.php on line 141
Warning: DOMDocument::loadHTML(): Unexpected end tag : a in Entity, line: 237 in /home/u552734802/domains/dailystocktopick.com/public_html/index.php on line 141
Warning: DOMDocument::loadHTML(): Unexpected end tag : a in Entity, line: 237 in /home/u552734802/domains/dailystocktopick.com/public_html/index.php on line 141
Warning: DOMDocument::loadHTML(): Unexpected end tag : a in Entity, line: 237 in /home/u552734802/domains/dailystocktopick.com/public_html/index.php on line 141
Warning: DOMDocument::loadHTML(): Unexpected end tag : a in Entity, line: 237 in /home/u552734802/domains/dailystocktopick.com/public_html/index.php on line 141
Warning: DOMDocument::loadHTML(): Unexpected end tag : a in Entity, line: 237 in /home/u552734802/domains/dailystocktopick.com/public_html/index.php on line 141
Warning: DOMDocument::loadHTML(): Unexpected end tag : a in Entity, line: 237 in /home/u552734802/domains/dailystocktopick.com/public_html/index.php on line 141
Warning: DOMDocument::loadHTML(): Unexpected end tag : a in Entity, line: 237 in /home/u552734802/domains/dailystocktopick.com/public_html/index.php on line 141
Warning: DOMDocument::loadHTML(): Unexpected end tag : a in Entity, line: 237 in /home/u552734802/domains/dailystocktopick.com/public_html/index.php on line 141
Warning: DOMDocument::loadHTML(): Unexpected end tag : div in Entity, line: 237 in /home/u552734802/domains/dailystocktopick.com/public_html/index.php on line 141
Warning: DOMDocument::loadHTML(): Unexpected end tag : li in Entity, line: 237 in /home/u552734802/domains/dailystocktopick.com/public_html/index.php on line 141
Warning: DOMDocument::loadHTML(): Unexpected end tag : div in Entity, line: 237 in /home/u552734802/domains/dailystocktopick.com/public_html/index.php on line 141
Warning: DOMDocument::loadHTML(): Unexpected end tag : a in Entity, line: 237 in /home/u552734802/domains/dailystocktopick.com/public_html/index.php on line 141
Warning: DOMDocument::loadHTML(): Unexpected end tag : a in Entity, line: 237 in /home/u552734802/domains/dailystocktopick.com/public_html/index.php on line 141
Warning: DOMDocument::loadHTML(): Unexpected end tag : a in Entity, line: 237 in /home/u552734802/domains/dailystocktopick.com/public_html/index.php on line 141
Warning: DOMDocument::loadHTML(): Unexpected end tag : a in Entity, line: 237 in /home/u552734802/domains/dailystocktopick.com/public_html/index.php on line 141
Warning: DOMDocument::loadHTML(): Unexpected end tag : a in Entity, line: 237 in /home/u552734802/domains/dailystocktopick.com/public_html/index.php on line 141
Warning: DOMDocument::loadHTML(): Unexpected end tag : a in Entity, line: 237 in /home/u552734802/domains/dailystocktopick.com/public_html/index.php on line 141
Warning: DOMDocument::loadHTML(): Unexpected end tag : a in Entity, line: 237 in /home/u552734802/domains/dailystocktopick.com/public_html/index.php on line 141
Warning: DOMDocument::loadHTML(): Unexpected end tag : a in Entity, line: 237 in /home/u552734802/domains/dailystocktopick.com/public_html/index.php on line 141
Warning: DOMDocument::loadHTML(): Unexpected end tag : a in Entity, line: 237 in /home/u552734802/domains/dailystocktopick.com/public_html/index.php on line 141
Warning: DOMDocument::loadHTML(): Unexpected end tag : a in Entity, line: 237 in /home/u552734802/domains/dailystocktopick.com/public_html/index.php on line 141
Warning: DOMDocument::loadHTML(): Unexpected end tag : a in Entity, line: 237 in /home/u552734802/domains/dailystocktopick.com/public_html/index.php on line 141
Warning: DOMDocument::loadHTML(): Unexpected end tag : a in Entity, line: 237 in /home/u552734802/domains/dailystocktopick.com/public_html/index.php on line 141
Warning: DOMDocument::loadHTML(): Unexpected end tag : div in Entity, line: 237 in /home/u552734802/domains/dailystocktopick.com/public_html/index.php on line 141
Warning: DOMDocument::loadHTML(): Unexpected end tag : li in Entity, line: 237 in /home/u552734802/domains/dailystocktopick.com/public_html/index.php on line 141
Warning: DOMDocument::loadHTML(): Unexpected end tag : div in Entity, line: 237 in /home/u552734802/domains/dailystocktopick.com/public_html/index.php on line 141
Warning: DOMDocument::loadHTML(): Unexpected end tag : a in Entity, line: 237 in /home/u552734802/domains/dailystocktopick.com/public_html/index.php on line 141
Warning: DOMDocument::loadHTML(): Unexpected end tag : a in Entity, line: 237 in /home/u552734802/domains/dailystocktopick.com/public_html/index.php on line 141
Warning: DOMDocument::loadHTML(): Unexpected end tag : a in Entity, line: 237 in /home/u552734802/domains/dailystocktopick.com/public_html/index.php on line 141
Warning: DOMDocument::loadHTML(): Unexpected end tag : a in Entity, line: 237 in /home/u552734802/domains/dailystocktopick.com/public_html/index.php on line 141
Warning: DOMDocument::loadHTML(): Unexpected end tag : a in Entity, line: 237 in /home/u552734802/domains/dailystocktopick.com/public_html/index.php on line 141
Warning: DOMDocument::loadHTML(): Unexpected end tag : a in Entity, line: 237 in /home/u552734802/domains/dailystocktopick.com/public_html/index.php on line 141
Warning: DOMDocument::loadHTML(): Unexpected end tag : div in Entity, line: 237 in /home/u552734802/domains/dailystocktopick.com/public_html/index.php on line 141
Warning: DOMDocument::loadHTML(): Unexpected end tag : li in Entity, line: 237 in /home/u552734802/domains/dailystocktopick.com/public_html/index.php on line 141
Warning: DOMDocument::loadHTML(): Unexpected end tag : div in Entity, line: 237 in /home/u552734802/domains/dailystocktopick.com/public_html/index.php on line 141
Warning: DOMDocument::loadHTML(): Unexpected end tag : a in Entity, line: 237 in /home/u552734802/domains/dailystocktopick.com/public_html/index.php on line 141
Warning: DOMDocument::loadHTML(): Unexpected end tag : a in Entity, line: 237 in /home/u552734802/domains/dailystocktopick.com/public_html/index.php on line 141
Warning: DOMDocument::loadHTML(): Unexpected end tag : a in Entity, line: 237 in /home/u552734802/domains/dailystocktopick.com/public_html/index.php on line 141
Warning: DOMDocument::loadHTML(): Unexpected end tag : a in Entity, line: 237 in /home/u552734802/domains/dailystocktopick.com/public_html/index.php on line 141
Warning: DOMDocument::loadHTML(): Unexpected end tag : a in Entity, line: 237 in /home/u552734802/domains/dailystocktopick.com/public_html/index.php on line 141
Warning: DOMDocument::loadHTML(): Unexpected end tag : a in Entity, line: 237 in /home/u552734802/domains/dailystocktopick.com/public_html/index.php on line 141
Warning: DOMDocument::loadHTML(): Unexpected end tag : a in Entity, line: 237 in /home/u552734802/domains/dailystocktopick.com/public_html/index.php on line 141
Warning: DOMDocument::loadHTML(): Unexpected end tag : a in Entity, line: 237 in /home/u552734802/domains/dailystocktopick.com/public_html/index.php on line 141
Warning: DOMDocument::loadHTML(): Unexpected end tag : a in Entity, line: 237 in /home/u552734802/domains/dailystocktopick.com/public_html/index.php on line 141
Warning: DOMDocument::loadHTML(): Unexpected end tag : a in Entity, line: 237 in /home/u552734802/domains/dailystocktopick.com/public_html/index.php on line 141
Warning: DOMDocument::loadHTML(): Unexpected end tag : a in Entity, line: 237 in /home/u552734802/domains/dailystocktopick.com/public_html/index.php on line 141
Warning: DOMDocument::loadHTML(): Unexpected end tag : a in Entity, line: 237 in /home/u552734802/domains/dailystocktopick.com/public_html/index.php on line 141
Warning: DOMDocument::loadHTML(): Unexpected end tag : a in Entity, line: 237 in /home/u552734802/domains/dailystocktopick.com/public_html/index.php on line 141
Warning: DOMDocument::loadHTML(): Unexpected end tag : a in Entity, line: 237 in /home/u552734802/domains/dailystocktopick.com/public_html/index.php on line 141
Warning: DOMDocument::loadHTML(): Unexpected end tag : a in Entity, line: 237 in /home/u552734802/domains/dailystocktopick.com/public_html/index.php on line 141
Warning: DOMDocument::loadHTML(): Unexpected end tag : a in Entity, line: 237 in /home/u552734802/domains/dailystocktopick.com/public_html/index.php on line 141
Warning: DOMDocument::loadHTML(): Unexpected end tag : a in Entity, line: 237 in /home/u552734802/domains/dailystocktopick.com/public_html/index.php on line 141
Warning: DOMDocument::loadHTML(): Unexpected end tag : a in Entity, line: 237 in /home/u552734802/domains/dailystocktopick.com/public_html/index.php on line 141
Warning: DOMDocument::loadHTML(): Unexpected end tag : div in Entity, line: 237 in /home/u552734802/domains/dailystocktopick.com/public_html/index.php on line 141
Warning: DOMDocument::loadHTML(): Unexpected end tag : li in Entity, line: 237 in /home/u552734802/domains/dailystocktopick.com/public_html/index.php on line 141
Warning: DOMDocument::loadHTML(): Unexpected end tag : div in Entity, line: 237 in /home/u552734802/domains/dailystocktopick.com/public_html/index.php on line 141
Warning: DOMDocument::loadHTML(): Unexpected end tag : a in Entity, line: 237 in /home/u552734802/domains/dailystocktopick.com/public_html/index.php on line 141
Warning: DOMDocument::loadHTML(): Unexpected end tag : a in Entity, line: 237 in /home/u552734802/domains/dailystocktopick.com/public_html/index.php on line 141
Warning: DOMDocument::loadHTML(): Unexpected end tag : a in Entity, line: 237 in /home/u552734802/domains/dailystocktopick.com/public_html/index.php on line 141
Warning: DOMDocument::loadHTML(): Unexpected end tag : a in Entity, line: 237 in /home/u552734802/domains/dailystocktopick.com/public_html/index.php on line 141
Warning: DOMDocument::loadHTML(): Unexpected end tag : a in Entity, line: 237 in /home/u552734802/domains/dailystocktopick.com/public_html/index.php on line 141
Warning: DOMDocument::loadHTML(): Unexpected end tag : a in Entity, line: 237 in /home/u552734802/domains/dailystocktopick.com/public_html/index.php on line 141
Warning: DOMDocument::loadHTML(): Unexpected end tag : a in Entity, line: 237 in /home/u552734802/domains/dailystocktopick.com/public_html/index.php on line 141
Warning: DOMDocument::loadHTML(): Unexpected end tag : a in Entity, line: 237 in /home/u552734802/domains/dailystocktopick.com/public_html/index.php on line 141
Warning: DOMDocument::loadHTML(): Unexpected end tag : a in Entity, line: 237 in /home/u552734802/domains/dailystocktopick.com/public_html/index.php on line 141
Warning: DOMDocument::loadHTML(): Unexpected end tag : a in Entity, line: 237 in /home/u552734802/domains/dailystocktopick.com/public_html/index.php on line 141
Warning: DOMDocument::loadHTML(): Unexpected end tag : a in Entity, line: 237 in /home/u552734802/domains/dailystocktopick.com/public_html/index.php on line 141
Warning: DOMDocument::loadHTML(): Unexpected end tag : a in Entity, line: 237 in /home/u552734802/domains/dailystocktopick.com/public_html/index.php on line 141
Warning: DOMDocument::loadHTML(): Unexpected end tag : a in Entity, line: 237 in /home/u552734802/domains/dailystocktopick.com/public_html/index.php on line 141
Warning: DOMDocument::loadHTML(): Unexpected end tag : a in Entity, line: 237 in /home/u552734802/domains/dailystocktopick.com/public_html/index.php on line 141
Warning: DOMDocument::loadHTML(): Unexpected end tag : a in Entity, line: 237 in /home/u552734802/domains/dailystocktopick.com/public_html/index.php on line 141
Warning: DOMDocument::loadHTML(): Unexpected end tag : div in Entity, line: 237 in /home/u552734802/domains/dailystocktopick.com/public_html/index.php on line 141
Warning: DOMDocument::loadHTML(): Unexpected end tag : li in Entity, line: 237 in /home/u552734802/domains/dailystocktopick.com/public_html/index.php on line 141
Warning: DOMDocument::loadHTML(): Unexpected end tag : div in Entity, line: 237 in /home/u552734802/domains/dailystocktopick.com/public_html/index.php on line 141
Warning: DOMDocument::loadHTML(): Unexpected end tag : a in Entity, line: 237 in /home/u552734802/domains/dailystocktopick.com/public_html/index.php on line 141
Warning: DOMDocument::loadHTML(): Unexpected end tag : a in Entity, line: 237 in /home/u552734802/domains/dailystocktopick.com/public_html/index.php on line 141
Warning: DOMDocument::loadHTML(): Unexpected end tag : a in Entity, line: 237 in /home/u552734802/domains/dailystocktopick.com/public_html/index.php on line 141
Warning: DOMDocument::loadHTML(): Unexpected end tag : a in Entity, line: 237 in /home/u552734802/domains/dailystocktopick.com/public_html/index.php on line 141
Warning: DOMDocument::loadHTML(): Unexpected end tag : a in Entity, line: 237 in /home/u552734802/domains/dailystocktopick.com/public_html/index.php on line 141
Warning: DOMDocument::loadHTML(): Unexpected end tag : a in Entity, line: 237 in /home/u552734802/domains/dailystocktopick.com/public_html/index.php on line 141
Warning: DOMDocument::loadHTML(): Unexpected end tag : a in Entity, line: 237 in /home/u552734802/domains/dailystocktopick.com/public_html/index.php on line 141
Warning: DOMDocument::loadHTML(): Unexpected end tag : a in Entity, line: 237 in /home/u552734802/domains/dailystocktopick.com/public_html/index.php on line 141
Warning: DOMDocument::loadHTML(): Unexpected end tag : a in Entity, line: 237 in /home/u552734802/domains/dailystocktopick.com/public_html/index.php on line 141
Warning: DOMDocument::loadHTML(): Unexpected end tag : a in Entity, line: 237 in /home/u552734802/domains/dailystocktopick.com/public_html/index.php on line 141
Warning: DOMDocument::loadHTML(): Unexpected end tag : a in Entity, line: 237 in /home/u552734802/domains/dailystocktopick.com/public_html/index.php on line 141
Warning: DOMDocument::loadHTML(): Unexpected end tag : a in Entity, line: 237 in /home/u552734802/domains/dailystocktopick.com/public_html/index.php on line 141
Warning: DOMDocument::loadHTML(): Unexpected end tag : a in Entity, line: 237 in /home/u552734802/domains/dailystocktopick.com/public_html/index.php on line 141
Warning: DOMDocument::loadHTML(): Unexpected end tag : div in Entity, line: 237 in /home/u552734802/domains/dailystocktopick.com/public_html/index.php on line 141
Warning: DOMDocument::loadHTML(): Unexpected end tag : li in Entity, line: 237 in /home/u552734802/domains/dailystocktopick.com/public_html/index.php on line 141
Warning: DOMDocument::loadHTML(): Unexpected end tag : div in Entity, line: 237 in /home/u552734802/domains/dailystocktopick.com/public_html/index.php on line 141
Warning: DOMDocument::loadHTML(): Unexpected end tag : a in Entity, line: 237 in /home/u552734802/domains/dailystocktopick.com/public_html/index.php on line 141
Warning: DOMDocument::loadHTML(): Unexpected end tag : a in Entity, line: 237 in /home/u552734802/domains/dailystocktopick.com/public_html/index.php on line 141
Warning: DOMDocument::loadHTML(): Unexpected end tag : a in Entity, line: 237 in /home/u552734802/domains/dailystocktopick.com/public_html/index.php on line 141
Warning: DOMDocument::loadHTML(): Unexpected end tag : a in Entity, line: 237 in /home/u552734802/domains/dailystocktopick.com/public_html/index.php on line 141
Warning: DOMDocument::loadHTML(): Unexpected end tag : a in Entity, line: 237 in /home/u552734802/domains/dailystocktopick.com/public_html/index.php on line 141
Warning: DOMDocument::loadHTML(): Unexpected end tag : a in Entity, line: 237 in /home/u552734802/domains/dailystocktopick.com/public_html/index.php on line 141
Warning: DOMDocument::loadHTML(): Unexpected end tag : a in Entity, line: 237 in /home/u552734802/domains/dailystocktopick.com/public_html/index.php on line 141
Warning: DOMDocument::loadHTML(): Unexpected end tag : a in Entity, line: 237 in /home/u552734802/domains/dailystocktopick.com/public_html/index.php on line 141
Warning: DOMDocument::loadHTML(): Unexpected end tag : a in Entity, line: 237 in /home/u552734802/domains/dailystocktopick.com/public_html/index.php on line 141
Warning: DOMDocument::loadHTML(): Unexpected end tag : a in Entity, line: 237 in /home/u552734802/domains/dailystocktopick.com/public_html/index.php on line 141
Warning: DOMDocument::loadHTML(): Unexpected end tag : a in Entity, line: 237 in /home/u552734802/domains/dailystocktopick.com/public_html/index.php on line 141
Warning: DOMDocument::loadHTML(): Unexpected end tag : a in Entity, line: 237 in /home/u552734802/domains/dailystocktopick.com/public_html/index.php on line 141
Warning: DOMDocument::loadHTML(): Unexpected end tag : a in Entity, line: 237 in /home/u552734802/domains/dailystocktopick.com/public_html/index.php on line 141
Warning: DOMDocument::loadHTML(): Unexpected end tag : a in Entity, line: 237 in /home/u552734802/domains/dailystocktopick.com/public_html/index.php on line 141
Warning: DOMDocument::loadHTML(): Unexpected end tag : a in Entity, line: 237 in /home/u552734802/domains/dailystocktopick.com/public_html/index.php on line 141
Warning: DOMDocument::loadHTML(): Unexpected end tag : a in Entity, line: 237 in /home/u552734802/domains/dailystocktopick.com/public_html/index.php on line 141
Warning: DOMDocument::loadHTML(): Unexpected end tag : div in Entity, line: 237 in /home/u552734802/domains/dailystocktopick.com/public_html/index.php on line 141
Warning: DOMDocument::loadHTML(): Unexpected end tag : li in Entity, line: 237 in /home/u552734802/domains/dailystocktopick.com/public_html/index.php on line 141
Warning: DOMDocument::loadHTML(): Unexpected end tag : div in Entity, line: 237 in /home/u552734802/domains/dailystocktopick.com/public_html/index.php on line 141
Warning: DOMDocument::loadHTML(): Unexpected end tag : a in Entity, line: 237 in /home/u552734802/domains/dailystocktopick.com/public_html/index.php on line 141
Warning: DOMDocument::loadHTML(): Unexpected end tag : a in Entity, line: 237 in /home/u552734802/domains/dailystocktopick.com/public_html/index.php on line 141
Warning: DOMDocument::loadHTML(): Unexpected end tag : a in Entity, line: 237 in /home/u552734802/domains/dailystocktopick.com/public_html/index.php on line 141
Warning: DOMDocument::loadHTML(): Unexpected end tag : a in Entity, line: 237 in /home/u552734802/domains/dailystocktopick.com/public_html/index.php on line 141
Warning: DOMDocument::loadHTML(): Unexpected end tag : a in Entity, line: 237 in /home/u552734802/domains/dailystocktopick.com/public_html/index.php on line 141
Warning: DOMDocument::loadHTML(): Unexpected end tag : a in Entity, line: 237 in /home/u552734802/domains/dailystocktopick.com/public_html/index.php on line 141
Warning: DOMDocument::loadHTML(): Unexpected end tag : a in Entity, line: 237 in /home/u552734802/domains/dailystocktopick.com/public_html/index.php on line 141
Warning: DOMDocument::loadHTML(): Unexpected end tag : a in Entity, line: 237 in /home/u552734802/domains/dailystocktopick.com/public_html/index.php on line 141
Warning: DOMDocument::loadHTML(): Unexpected end tag : a in Entity, line: 237 in /home/u552734802/domains/dailystocktopick.com/public_html/index.php on line 141
Warning: DOMDocument::loadHTML(): Unexpected end tag : a in Entity, line: 237 in /home/u552734802/domains/dailystocktopick.com/public_html/index.php on line 141
Warning: DOMDocument::loadHTML(): Unexpected end tag : a in Entity, line: 237 in /home/u552734802/domains/dailystocktopick.com/public_html/index.php on line 141
Warning: DOMDocument::loadHTML(): Unexpected end tag : a in Entity, line: 237 in /home/u552734802/domains/dailystocktopick.com/public_html/index.php on line 141
Warning: DOMDocument::loadHTML(): Unexpected end tag : a in Entity, line: 237 in /home/u552734802/domains/dailystocktopick.com/public_html/index.php on line 141
Warning: DOMDocument::loadHTML(): Unexpected end tag : a in Entity, line: 237 in /home/u552734802/domains/dailystocktopick.com/public_html/index.php on line 141
Warning: DOMDocument::loadHTML(): Unexpected end tag : a in Entity, line: 237 in /home/u552734802/domains/dailystocktopick.com/public_html/index.php on line 141
Warning: DOMDocument::loadHTML(): Unexpected end tag : a in Entity, line: 237 in /home/u552734802/domains/dailystocktopick.com/public_html/index.php on line 141
Warning: DOMDocument::loadHTML(): Unexpected end tag : div in Entity, line: 237 in /home/u552734802/domains/dailystocktopick.com/public_html/index.php on line 141
Warning: DOMDocument::loadHTML(): Unexpected end tag : li in Entity, line: 237 in /home/u552734802/domains/dailystocktopick.com/public_html/index.php on line 141
Warning: DOMDocument::loadHTML(): Unexpected end tag : div in Entity, line: 237 in /home/u552734802/domains/dailystocktopick.com/public_html/index.php on line 141
Warning: DOMDocument::loadHTML(): Unexpected end tag : a in Entity, line: 237 in /home/u552734802/domains/dailystocktopick.com/public_html/index.php on line 141
Warning: DOMDocument::loadHTML(): Unexpected end tag : a in Entity, line: 237 in /home/u552734802/domains/dailystocktopick.com/public_html/index.php on line 141
Warning: DOMDocument::loadHTML(): Unexpected end tag : a in Entity, line: 237 in /home/u552734802/domains/dailystocktopick.com/public_html/index.php on line 141
Warning: DOMDocument::loadHTML(): Unexpected end tag : a in Entity, line: 237 in /home/u552734802/domains/dailystocktopick.com/public_html/index.php on line 141
Warning: DOMDocument::loadHTML(): Unexpected end tag : a in Entity, line: 237 in /home/u552734802/domains/dailystocktopick.com/public_html/index.php on line 141
Warning: DOMDocument::loadHTML(): Unexpected end tag : a in Entity, line: 237 in /home/u552734802/domains/dailystocktopick.com/public_html/index.php on line 141
Warning: DOMDocument::loadHTML(): Unexpected end tag : a in Entity, line: 237 in /home/u552734802/domains/dailystocktopick.com/public_html/index.php on line 141
Warning: DOMDocument::loadHTML(): Unexpected end tag : a in Entity, line: 237 in /home/u552734802/domains/dailystocktopick.com/public_html/index.php on line 141
Warning: DOMDocument::loadHTML(): Unexpected end tag : a in Entity, line: 237 in /home/u552734802/domains/dailystocktopick.com/public_html/index.php on line 141
Warning: DOMDocument::loadHTML(): Unexpected end tag : a in Entity, line: 237 in /home/u552734802/domains/dailystocktopick.com/public_html/index.php on line 141
Warning: DOMDocument::loadHTML(): Unexpected end tag : a in Entity, line: 237 in /home/u552734802/domains/dailystocktopick.com/public_html/index.php on line 141
Warning: DOMDocument::loadHTML(): Unexpected end tag : a in Entity, line: 237 in /home/u552734802/domains/dailystocktopick.com/public_html/index.php on line 141
Warning: DOMDocument::loadHTML(): Unexpected end tag : a in Entity, line: 237 in /home/u552734802/domains/dailystocktopick.com/public_html/index.php on line 141
Warning: DOMDocument::loadHTML(): Unexpected end tag : a in Entity, line: 237 in /home/u552734802/domains/dailystocktopick.com/public_html/index.php on line 141
Warning: DOMDocument::loadHTML(): Unexpected end tag : a in Entity, line: 237 in /home/u552734802/domains/dailystocktopick.com/public_html/index.php on line 141
Warning: DOMDocument::loadHTML(): Unexpected end tag : a in Entity, line: 237 in /home/u552734802/domains/dailystocktopick.com/public_html/index.php on line 141
Warning: DOMDocument::loadHTML(): Unexpected end tag : a in Entity, line: 237 in /home/u552734802/domains/dailystocktopick.com/public_html/index.php on line 141
Warning: DOMDocument::loadHTML(): Unexpected end tag : a in Entity, line: 237 in /home/u552734802/domains/dailystocktopick.com/public_html/index.php on line 141
Warning: DOMDocument::loadHTML(): Unexpected end tag : div in Entity, line: 237 in /home/u552734802/domains/dailystocktopick.com/public_html/index.php on line 141
Warning: DOMDocument::loadHTML(): Unexpected end tag : li in Entity, line: 237 in /home/u552734802/domains/dailystocktopick.com/public_html/index.php on line 141
Warning: DOMDocument::loadHTML(): Unexpected end tag : div in Entity, line: 237 in /home/u552734802/domains/dailystocktopick.com/public_html/index.php on line 141
Warning: DOMDocument::loadHTML(): Unexpected end tag : a in Entity, line: 237 in /home/u552734802/domains/dailystocktopick.com/public_html/index.php on line 141
Warning: DOMDocument::loadHTML(): Unexpected end tag : a in Entity, line: 237 in /home/u552734802/domains/dailystocktopick.com/public_html/index.php on line 141
Warning: DOMDocument::loadHTML(): Unexpected end tag : a in Entity, line: 237 in /home/u552734802/domains/dailystocktopick.com/public_html/index.php on line 141
Warning: DOMDocument::loadHTML(): Unexpected end tag : a in Entity, line: 237 in /home/u552734802/domains/dailystocktopick.com/public_html/index.php on line 141
Warning: DOMDocument::loadHTML(): Unexpected end tag : a in Entity, line: 237 in /home/u552734802/domains/dailystocktopick.com/public_html/index.php on line 141
Warning: DOMDocument::loadHTML(): Unexpected end tag : a in Entity, line: 237 in /home/u552734802/domains/dailystocktopick.com/public_html/index.php on line 141
Warning: DOMDocument::loadHTML(): Unexpected end tag : a in Entity, line: 237 in /home/u552734802/domains/dailystocktopick.com/public_html/index.php on line 141
Warning: DOMDocument::loadHTML(): Unexpected end tag : a in Entity, line: 237 in /home/u552734802/domains/dailystocktopick.com/public_html/index.php on line 141
Warning: DOMDocument::loadHTML(): Unexpected end tag : a in Entity, line: 237 in /home/u552734802/domains/dailystocktopick.com/public_html/index.php on line 141
Warning: DOMDocument::loadHTML(): Unexpected end tag : a in Entity, line: 237 in /home/u552734802/domains/dailystocktopick.com/public_html/index.php on line 141
Warning: DOMDocument::loadHTML(): Unexpected end tag : div in Entity, line: 237 in /home/u552734802/domains/dailystocktopick.com/public_html/index.php on line 141
Warning: DOMDocument::loadHTML(): Unexpected end tag : li in Entity, line: 237 in /home/u552734802/domains/dailystocktopick.com/public_html/index.php on line 141
Warning: DOMDocument::loadHTML(): Unexpected end tag : div in Entity, line: 237 in /home/u552734802/domains/dailystocktopick.com/public_html/index.php on line 141
Warning: DOMDocument::loadHTML(): Unexpected end tag : a in Entity, line: 237 in /home/u552734802/domains/dailystocktopick.com/public_html/index.php on line 141
Warning: DOMDocument::loadHTML(): Unexpected end tag : a in Entity, line: 237 in /home/u552734802/domains/dailystocktopick.com/public_html/index.php on line 141
Warning: DOMDocument::loadHTML(): Unexpected end tag : a in Entity, line: 237 in /home/u552734802/domains/dailystocktopick.com/public_html/index.php on line 141
Warning: DOMDocument::loadHTML(): Unexpected end tag : a in Entity, line: 237 in /home/u552734802/domains/dailystocktopick.com/public_html/index.php on line 141
Warning: DOMDocument::loadHTML(): Unexpected end tag : a in Entity, line: 237 in /home/u552734802/domains/dailystocktopick.com/public_html/index.php on line 141
Warning: DOMDocument::loadHTML(): Unexpected end tag : a in Entity, line: 237 in /home/u552734802/domains/dailystocktopick.com/public_html/index.php on line 141
Warning: DOMDocument::loadHTML(): Unexpected end tag : a in Entity, line: 237 in /home/u552734802/domains/dailystocktopick.com/public_html/index.php on line 141
Warning: DOMDocument::loadHTML(): Unexpected end tag : a in Entity, line: 237 in /home/u552734802/domains/dailystocktopick.com/public_html/index.php on line 141
Warning: DOMDocument::loadHTML(): Unexpected end tag : a in Entity, line: 237 in /home/u552734802/domains/dailystocktopick.com/public_html/index.php on line 141
Warning: DOMDocument::loadHTML(): Unexpected end tag : a in Entity, line: 237 in /home/u552734802/domains/dailystocktopick.com/public_html/index.php on line 141
Warning: DOMDocument::loadHTML(): Unexpected end tag : div in Entity, line: 237 in /home/u552734802/domains/dailystocktopick.com/public_html/index.php on line 141
Warning: DOMDocument::loadHTML(): Unexpected end tag : li in Entity, line: 237 in /home/u552734802/domains/dailystocktopick.com/public_html/index.php on line 141
Warning: DOMDocument::loadHTML(): Unexpected end tag : div in Entity, line: 237 in /home/u552734802/domains/dailystocktopick.com/public_html/index.php on line 141
Warning: DOMDocument::loadHTML(): Unexpected end tag : a in Entity, line: 237 in /home/u552734802/domains/dailystocktopick.com/public_html/index.php on line 141
Warning: DOMDocument::loadHTML(): Unexpected end tag : a in Entity, line: 237 in /home/u552734802/domains/dailystocktopick.com/public_html/index.php on line 141
Warning: DOMDocument::loadHTML(): Unexpected end tag : a in Entity, line: 237 in /home/u552734802/domains/dailystocktopick.com/public_html/index.php on line 141
Warning: DOMDocument::loadHTML(): Unexpected end tag : a in Entity, line: 237 in /home/u552734802/domains/dailystocktopick.com/public_html/index.php on line 141
Warning: DOMDocument::loadHTML(): Unexpected end tag : a in Entity, line: 237 in /home/u552734802/domains/dailystocktopick.com/public_html/index.php on line 141
Warning: DOMDocument::loadHTML(): Unexpected end tag : a in Entity, line: 237 in /home/u552734802/domains/dailystocktopick.com/public_html/index.php on line 141
Warning: DOMDocument::loadHTML(): Unexpected end tag : a in Entity, line: 237 in /home/u552734802/domains/dailystocktopick.com/public_html/index.php on line 141
Warning: DOMDocument::loadHTML(): Unexpected end tag : a in Entity, line: 237 in /home/u552734802/domains/dailystocktopick.com/public_html/index.php on line 141
Warning: DOMDocument::loadHTML(): Unexpected end tag : a in Entity, line: 237 in /home/u552734802/domains/dailystocktopick.com/public_html/index.php on line 141
Warning: DOMDocument::loadHTML(): Unexpected end tag : a in Entity, line: 237 in /home/u552734802/domains/dailystocktopick.com/public_html/index.php on line 141
Warning: DOMDocument::loadHTML(): Unexpected end tag : a in Entity, line: 237 in /home/u552734802/domains/dailystocktopick.com/public_html/index.php on line 141
Warning: DOMDocument::loadHTML(): Unexpected end tag : div in Entity, line: 237 in /home/u552734802/domains/dailystocktopick.com/public_html/index.php on line 141
Warning: DOMDocument::loadHTML(): Unexpected end tag : li in Entity, line: 237 in /home/u552734802/domains/dailystocktopick.com/public_html/index.php on line 141
Warning: DOMDocument::loadHTML(): Unexpected end tag : div in Entity, line: 237 in /home/u552734802/domains/dailystocktopick.com/public_html/index.php on line 141
Warning: DOMDocument::loadHTML(): Unexpected end tag : a in Entity, line: 237 in /home/u552734802/domains/dailystocktopick.com/public_html/index.php on line 141
Warning: DOMDocument::loadHTML(): Unexpected end tag : a in Entity, line: 237 in /home/u552734802/domains/dailystocktopick.com/public_html/index.php on line 141
Warning: DOMDocument::loadHTML(): Unexpected end tag : a in Entity, line: 237 in /home/u552734802/domains/dailystocktopick.com/public_html/index.php on line 141
Warning: DOMDocument::loadHTML(): Unexpected end tag : a in Entity, line: 237 in /home/u552734802/domains/dailystocktopick.com/public_html/index.php on line 141
Warning: DOMDocument::loadHTML(): Unexpected end tag : a in Entity, line: 237 in /home/u552734802/domains/dailystocktopick.com/public_html/index.php on line 141
Warning: DOMDocument::loadHTML(): Unexpected end tag : a in Entity, line: 237 in /home/u552734802/domains/dailystocktopick.com/public_html/index.php on line 141
Warning: DOMDocument::loadHTML(): Unexpected end tag : a in Entity, line: 237 in /home/u552734802/domains/dailystocktopick.com/public_html/index.php on line 141
Warning: DOMDocument::loadHTML(): Unexpected end tag : a in Entity, line: 237 in /home/u552734802/domains/dailystocktopick.com/public_html/index.php on line 141
Warning: DOMDocument::loadHTML(): Unexpected end tag : a in Entity, line: 237 in /home/u552734802/domains/dailystocktopick.com/public_html/index.php on line 141
Warning: DOMDocument::loadHTML(): Unexpected end tag : a in Entity, line: 237 in /home/u552734802/domains/dailystocktopick.com/public_html/index.php on line 141
Warning: DOMDocument::loadHTML(): Unexpected end tag : a in Entity, line: 237 in /home/u552734802/domains/dailystocktopick.com/public_html/index.php on line 141
Warning: DOMDocument::loadHTML(): Unexpected end tag : a in Entity, line: 237 in /home/u552734802/domains/dailystocktopick.com/public_html/index.php on line 141
Warning: DOMDocument::loadHTML(): Unexpected end tag : a in Entity, line: 237 in /home/u552734802/domains/dailystocktopick.com/public_html/index.php on line 141
Warning: DOMDocument::loadHTML(): Unexpected end tag : a in Entity, line: 237 in /home/u552734802/domains/dailystocktopick.com/public_html/index.php on line 141
Warning: DOMDocument::loadHTML(): Unexpected end tag : a in Entity, line: 237 in /home/u552734802/domains/dailystocktopick.com/public_html/index.php on line 141
Warning: DOMDocument::loadHTML(): Unexpected end tag : a in Entity, line: 237 in /home/u552734802/domains/dailystocktopick.com/public_html/index.php on line 141
Warning: DOMDocument::loadHTML(): Unexpected end tag : a in Entity, line: 237 in /home/u552734802/domains/dailystocktopick.com/public_html/index.php on line 141
Warning: DOMDocument::loadHTML(): Unexpected end tag : div in Entity, line: 237 in /home/u552734802/domains/dailystocktopick.com/public_html/index.php on line 141
Warning: DOMDocument::loadHTML(): Unexpected end tag : li in Entity, line: 237 in /home/u552734802/domains/dailystocktopick.com/public_html/index.php on line 141
Warning: DOMDocument::loadHTML(): Unexpected end tag : div in Entity, line: 237 in /home/u552734802/domains/dailystocktopick.com/public_html/index.php on line 141
Warning: DOMDocument::loadHTML(): Unexpected end tag : a in Entity, line: 237 in /home/u552734802/domains/dailystocktopick.com/public_html/index.php on line 141
Warning: DOMDocument::loadHTML(): Unexpected end tag : a in Entity, line: 237 in /home/u552734802/domains/dailystocktopick.com/public_html/index.php on line 141
Warning: DOMDocument::loadHTML(): Unexpected end tag : a in Entity, line: 237 in /home/u552734802/domains/dailystocktopick.com/public_html/index.php on line 141
Warning: DOMDocument::loadHTML(): Unexpected end tag : a in Entity, line: 237 in /home/u552734802/domains/dailystocktopick.com/public_html/index.php on line 141
Warning: DOMDocument::loadHTML(): Unexpected end tag : a in Entity, line: 237 in /home/u552734802/domains/dailystocktopick.com/public_html/index.php on line 141
Warning: DOMDocument::loadHTML(): Unexpected end tag : a in Entity, line: 237 in /home/u552734802/domains/dailystocktopick.com/public_html/index.php on line 141
Warning: DOMDocument::loadHTML(): Unexpected end tag : a in Entity, line: 237 in /home/u552734802/domains/dailystocktopick.com/public_html/index.php on line 141
Warning: DOMDocument::loadHTML(): Unexpected end tag : a in Entity, line: 237 in /home/u552734802/domains/dailystocktopick.com/public_html/index.php on line 141
Warning: DOMDocument::loadHTML(): Unexpected end tag : a in Entity, line: 237 in /home/u552734802/domains/dailystocktopick.com/public_html/index.php on line 141
Warning: DOMDocument::loadHTML(): Unexpected end tag : a in Entity, line: 237 in /home/u552734802/domains/dailystocktopick.com/public_html/index.php on line 141
Warning: DOMDocument::loadHTML(): Unexpected end tag : a in Entity, line: 237 in /home/u552734802/domains/dailystocktopick.com/public_html/index.php on line 141
Warning: DOMDocument::loadHTML(): Unexpected end tag : a in Entity, line: 237 in /home/u552734802/domains/dailystocktopick.com/public_html/index.php on line 141
Warning: DOMDocument::loadHTML(): Unexpected end tag : a in Entity, line: 237 in /home/u552734802/domains/dailystocktopick.com/public_html/index.php on line 141
Warning: DOMDocument::loadHTML(): Unexpected end tag : div in Entity, line: 237 in /home/u552734802/domains/dailystocktopick.com/public_html/index.php on line 141
Warning: DOMDocument::loadHTML(): Unexpected end tag : li in Entity, line: 237 in /home/u552734802/domains/dailystocktopick.com/public_html/index.php on line 141
Warning: DOMDocument::loadHTML(): Unexpected end tag : div in Entity, line: 237 in /home/u552734802/domains/dailystocktopick.com/public_html/index.php on line 141
Warning: DOMDocument::loadHTML(): Unexpected end tag : a in Entity, line: 237 in /home/u552734802/domains/dailystocktopick.com/public_html/index.php on line 141
Warning: DOMDocument::loadHTML(): Unexpected end tag : a in Entity, line: 237 in /home/u552734802/domains/dailystocktopick.com/public_html/index.php on line 141
Warning: DOMDocument::loadHTML(): Unexpected end tag : a in Entity, line: 237 in /home/u552734802/domains/dailystocktopick.com/public_html/index.php on line 141
Warning: DOMDocument::loadHTML(): Unexpected end tag : a in Entity, line: 237 in /home/u552734802/domains/dailystocktopick.com/public_html/index.php on line 141
Warning: DOMDocument::loadHTML(): Unexpected end tag : a in Entity, line: 237 in /home/u552734802/domains/dailystocktopick.com/public_html/index.php on line 141
Warning: DOMDocument::loadHTML(): Unexpected end tag : a in Entity, line: 237 in /home/u552734802/domains/dailystocktopick.com/public_html/index.php on line 141
Warning: DOMDocument::loadHTML(): Unexpected end tag : a in Entity, line: 237 in /home/u552734802/domains/dailystocktopick.com/public_html/index.php on line 141
Warning: DOMDocument::loadHTML(): Unexpected end tag : a in Entity, line: 237 in /home/u552734802/domains/dailystocktopick.com/public_html/index.php on line 141
Warning: DOMDocument::loadHTML(): Unexpected end tag : a in Entity, line: 237 in /home/u552734802/domains/dailystocktopick.com/public_html/index.php on line 141
Warning: DOMDocument::loadHTML(): Unexpected end tag : a in Entity, line: 237 in /home/u552734802/domains/dailystocktopick.com/public_html/index.php on line 141
Warning: DOMDocument::loadHTML(): Unexpected end tag : a in Entity, line: 237 in /home/u552734802/domains/dailystocktopick.com/public_html/index.php on line 141
Warning: DOMDocument::loadHTML(): Unexpected end tag : a in Entity, line: 237 in /home/u552734802/domains/dailystocktopick.com/public_html/index.php on line 141
Warning: DOMDocument::loadHTML(): Unexpected end tag : a in Entity, line: 237 in /home/u552734802/domains/dailystocktopick.com/public_html/index.php on line 141
Warning: DOMDocument::loadHTML(): Unexpected end tag : a in Entity, line: 237 in /home/u552734802/domains/dailystocktopick.com/public_html/index.php on line 141
Warning: DOMDocument::loadHTML(): Unexpected end tag : a in Entity, line: 237 in /home/u552734802/domains/dailystocktopick.com/public_html/index.php on line 141
Warning: DOMDocument::loadHTML(): Unexpected end tag : div in Entity, line: 237 in /home/u552734802/domains/dailystocktopick.com/public_html/index.php on line 141
Warning: DOMDocument::loadHTML(): Unexpected end tag : li in Entity, line: 237 in /home/u552734802/domains/dailystocktopick.com/public_html/index.php on line 141
Warning: DOMDocument::loadHTML(): Unexpected end tag : div in Entity, line: 237 in /home/u552734802/domains/dailystocktopick.com/public_html/index.php on line 141
Warning: DOMDocument::loadHTML(): Unexpected end tag : a in Entity, line: 237 in /home/u552734802/domains/dailystocktopick.com/public_html/index.php on line 141
Warning: DOMDocument::loadHTML(): Unexpected end tag : a in Entity, line: 237 in /home/u552734802/domains/dailystocktopick.com/public_html/index.php on line 141
Warning: DOMDocument::loadHTML(): Unexpected end tag : a in Entity, line: 237 in /home/u552734802/domains/dailystocktopick.com/public_html/index.php on line 141
Warning: DOMDocument::loadHTML(): Unexpected end tag : a in Entity, line: 237 in /home/u552734802/domains/dailystocktopick.com/public_html/index.php on line 141
Warning: DOMDocument::loadHTML(): Unexpected end tag : a in Entity, line: 237 in /home/u552734802/domains/dailystocktopick.com/public_html/index.php on line 141
Warning: DOMDocument::loadHTML(): Unexpected end tag : a in Entity, line: 237 in /home/u552734802/domains/dailystocktopick.com/public_html/index.php on line 141
Warning: DOMDocument::loadHTML(): Unexpected end tag : a in Entity, line: 237 in /home/u552734802/domains/dailystocktopick.com/public_html/index.php on line 141
Warning: DOMDocument::loadHTML(): Unexpected end tag : a in Entity, line: 237 in /home/u552734802/domains/dailystocktopick.com/public_html/index.php on line 141
Warning: DOMDocument::loadHTML(): Unexpected end tag : a in Entity, line: 237 in /home/u552734802/domains/dailystocktopick.com/public_html/index.php on line 141
Warning: DOMDocument::loadHTML(): Unexpected end tag : a in Entity, line: 237 in /home/u552734802/domains/dailystocktopick.com/public_html/index.php on line 141
Warning: DOMDocument::loadHTML(): Unexpected end tag : div in Entity, line: 237 in /home/u552734802/domains/dailystocktopick.com/public_html/index.php on line 141
Warning: DOMDocument::loadHTML(): Unexpected end tag : li in Entity, line: 237 in /home/u552734802/domains/dailystocktopick.com/public_html/index.php on line 141
Warning: DOMDocument::loadHTML(): Unexpected end tag : div in Entity, line: 237 in /home/u552734802/domains/dailystocktopick.com/public_html/index.php on line 141
Warning: DOMDocument::loadHTML(): Unexpected end tag : a in Entity, line: 237 in /home/u552734802/domains/dailystocktopick.com/public_html/index.php on line 141
Warning: DOMDocument::loadHTML(): Unexpected end tag : a in Entity, line: 237 in /home/u552734802/domains/dailystocktopick.com/public_html/index.php on line 141
Warning: DOMDocument::loadHTML(): Unexpected end tag : a in Entity, line: 237 in /home/u552734802/domains/dailystocktopick.com/public_html/index.php on line 141
Warning: DOMDocument::loadHTML(): Unexpected end tag : a in Entity, line: 237 in /home/u552734802/domains/dailystocktopick.com/public_html/index.php on line 141
Warning: DOMDocument::loadHTML(): Unexpected end tag : a in Entity, line: 237 in /home/u552734802/domains/dailystocktopick.com/public_html/index.php on line 141
Warning: DOMDocument::loadHTML(): Unexpected end tag : a in Entity, line: 237 in /home/u552734802/domains/dailystocktopick.com/public_html/index.php on line 141
Warning: DOMDocument::loadHTML(): Unexpected end tag : a in Entity, line: 237 in /home/u552734802/domains/dailystocktopick.com/public_html/index.php on line 141
Warning: DOMDocument::loadHTML(): Unexpected end tag : a in Entity, line: 237 in /home/u552734802/domains/dailystocktopick.com/public_html/index.php on line 141
Warning: DOMDocument::loadHTML(): Unexpected end tag : a in Entity, line: 237 in /home/u552734802/domains/dailystocktopick.com/public_html/index.php on line 141
Warning: DOMDocument::loadHTML(): Unexpected end tag : a in Entity, line: 237 in /home/u552734802/domains/dailystocktopick.com/public_html/index.php on line 141
Warning: DOMDocument::loadHTML(): Unexpected end tag : a in Entity, line: 237 in /home/u552734802/domains/dailystocktopick.com/public_html/index.php on line 141
Warning: DOMDocument::loadHTML(): Unexpected end tag : a in Entity, line: 237 in /home/u552734802/domains/dailystocktopick.com/public_html/index.php on line 141
Warning: DOMDocument::loadHTML(): Unexpected end tag : a in Entity, line: 237 in /home/u552734802/domains/dailystocktopick.com/public_html/index.php on line 141
Warning: DOMDocument::loadHTML(): Unexpected end tag : a in Entity, line: 237 in /home/u552734802/domains/dailystocktopick.com/public_html/index.php on line 141
Warning: DOMDocument::loadHTML(): Unexpected end tag : a in Entity, line: 237 in /home/u552734802/domains/dailystocktopick.com/public_html/index.php on line 141
Warning: DOMDocument::loadHTML(): Unexpected end tag : a in Entity, line: 237 in /home/u552734802/domains/dailystocktopick.com/public_html/index.php on line 141
Warning: DOMDocument::loadHTML(): Unexpected end tag : a in Entity, line: 237 in /home/u552734802/domains/dailystocktopick.com/public_html/index.php on line 141
Warning: DOMDocument::loadHTML(): Unexpected end tag : a in Entity, line: 237 in /home/u552734802/domains/dailystocktopick.com/public_html/index.php on line 141
Warning: DOMDocument::loadHTML(): Unexpected end tag : a in Entity, line: 237 in /home/u552734802/domains/dailystocktopick.com/public_html/index.php on line 141
Warning: DOMDocument::loadHTML(): Unexpected end tag : div in Entity, line: 237 in /home/u552734802/domains/dailystocktopick.com/public_html/index.php on line 141
Warning: DOMDocument::loadHTML(): Unexpected end tag : li in Entity, line: 237 in /home/u552734802/domains/dailystocktopick.com/public_html/index.php on line 141
Warning: DOMDocument::loadHTML(): Unexpected end tag : div in Entity, line: 237 in /home/u552734802/domains/dailystocktopick.com/public_html/index.php on line 141
Warning: DOMDocument::loadHTML(): Unexpected end tag : a in Entity, line: 237 in /home/u552734802/domains/dailystocktopick.com/public_html/index.php on line 141
Warning: DOMDocument::loadHTML(): Unexpected end tag : a in Entity, line: 237 in /home/u552734802/domains/dailystocktopick.com/public_html/index.php on line 141
Warning: DOMDocument::loadHTML(): Unexpected end tag : a in Entity, line: 237 in /home/u552734802/domains/dailystocktopick.com/public_html/index.php on line 141
Warning: DOMDocument::loadHTML(): Unexpected end tag : a in Entity, line: 237 in /home/u552734802/domains/dailystocktopick.com/public_html/index.php on line 141
Warning: DOMDocument::loadHTML(): Unexpected end tag : a in Entity, line: 237 in /home/u552734802/domains/dailystocktopick.com/public_html/index.php on line 141
Warning: DOMDocument::loadHTML(): Unexpected end tag : a in Entity, line: 237 in /home/u552734802/domains/dailystocktopick.com/public_html/index.php on line 141
Warning: DOMDocument::loadHTML(): Unexpected end tag : a in Entity, line: 237 in /home/u552734802/domains/dailystocktopick.com/public_html/index.php on line 141
Warning: DOMDocument::loadHTML(): Unexpected end tag : a in Entity, line: 237 in /home/u552734802/domains/dailystocktopick.com/public_html/index.php on line 141
Warning: DOMDocument::loadHTML(): Unexpected end tag : a in Entity, line: 237 in /home/u552734802/domains/dailystocktopick.com/public_html/index.php on line 141
Warning: DOMDocument::loadHTML(): Unexpected end tag : a in Entity, line: 237 in /home/u552734802/domains/dailystocktopick.com/public_html/index.php on line 141
Warning: DOMDocument::loadHTML(): Unexpected end tag : a in Entity, line: 237 in /home/u552734802/domains/dailystocktopick.com/public_html/index.php on line 141
Warning: DOMDocument::loadHTML(): Unexpected end tag : a in Entity, line: 237 in /home/u552734802/domains/dailystocktopick.com/public_html/index.php on line 141
Warning: DOMDocument::loadHTML(): Unexpected end tag : a in Entity, line: 237 in /home/u552734802/domains/dailystocktopick.com/public_html/index.php on line 141
Warning: DOMDocument::loadHTML(): Unexpected end tag : div in Entity, line: 237 in /home/u552734802/domains/dailystocktopick.com/public_html/index.php on line 141
Warning: DOMDocument::loadHTML(): Unexpected end tag : li in Entity, line: 237 in /home/u552734802/domains/dailystocktopick.com/public_html/index.php on line 141
Warning: DOMDocument::loadHTML(): Unexpected end tag : div in Entity, line: 237 in /home/u552734802/domains/dailystocktopick.com/public_html/index.php on line 141
Warning: DOMDocument::loadHTML(): Unexpected end tag : a in Entity, line: 237 in /home/u552734802/domains/dailystocktopick.com/public_html/index.php on line 141
Warning: DOMDocument::loadHTML(): Unexpected end tag : a in Entity, line: 237 in /home/u552734802/domains/dailystocktopick.com/public_html/index.php on line 141
Warning: DOMDocument::loadHTML(): Unexpected end tag : a in Entity, line: 237 in /home/u552734802/domains/dailystocktopick.com/public_html/index.php on line 141
Warning: DOMDocument::loadHTML(): Unexpected end tag : a in Entity, line: 237 in /home/u552734802/domains/dailystocktopick.com/public_html/index.php on line 141
Warning: DOMDocument::loadHTML(): Unexpected end tag : a in Entity, line: 237 in /home/u552734802/domains/dailystocktopick.com/public_html/index.php on line 141
Warning: DOMDocument::loadHTML(): Unexpected end tag : a in Entity, line: 237 in /home/u552734802/domains/dailystocktopick.com/public_html/index.php on line 141
Warning: DOMDocument::loadHTML(): Unexpected end tag : a in Entity, line: 237 in /home/u552734802/domains/dailystocktopick.com/public_html/index.php on line 141
Warning: DOMDocument::loadHTML(): Unexpected end tag : a in Entity, line: 237 in /home/u552734802/domains/dailystocktopick.com/public_html/index.php on line 141
Warning: DOMDocument::loadHTML(): Unexpected end tag : div in Entity, line: 237 in /home/u552734802/domains/dailystocktopick.com/public_html/index.php on line 141
Warning: DOMDocument::loadHTML(): Unexpected end tag : li in Entity, line: 237 in /home/u552734802/domains/dailystocktopick.com/public_html/index.php on line 141
Warning: DOMDocument::loadHTML(): Unexpected end tag : div in Entity, line: 237 in /home/u552734802/domains/dailystocktopick.com/public_html/index.php on line 141
Warning: DOMDocument::loadHTML(): Unexpected end tag : a in Entity, line: 237 in /home/u552734802/domains/dailystocktopick.com/public_html/index.php on line 141
Warning: DOMDocument::loadHTML(): Unexpected end tag : a in Entity, line: 237 in /home/u552734802/domains/dailystocktopick.com/public_html/index.php on line 141
Warning: DOMDocument::loadHTML(): Unexpected end tag : a in Entity, line: 237 in /home/u552734802/domains/dailystocktopick.com/public_html/index.php on line 141
Warning: DOMDocument::loadHTML(): Unexpected end tag : a in Entity, line: 237 in /home/u552734802/domains/dailystocktopick.com/public_html/index.php on line 141
Warning: DOMDocument::loadHTML(): Unexpected end tag : a in Entity, line: 237 in /home/u552734802/domains/dailystocktopick.com/public_html/index.php on line 141
Warning: DOMDocument::loadHTML(): Unexpected end tag : a in Entity, line: 237 in /home/u552734802/domains/dailystocktopick.com/public_html/index.php on line 141
Warning: DOMDocument::loadHTML(): Unexpected end tag : a in Entity, line: 237 in /home/u552734802/domains/dailystocktopick.com/public_html/index.php on line 141
Warning: DOMDocument::loadHTML(): Unexpected end tag : a in Entity, line: 237 in /home/u552734802/domains/dailystocktopick.com/public_html/index.php on line 141
Warning: DOMDocument::loadHTML(): Unexpected end tag : a in Entity, line: 237 in /home/u552734802/domains/dailystocktopick.com/public_html/index.php on line 141
Warning: DOMDocument::loadHTML(): Unexpected end tag : a in Entity, line: 237 in /home/u552734802/domains/dailystocktopick.com/public_html/index.php on line 141
Warning: DOMDocument::loadHTML(): Unexpected end tag : a in Entity, line: 237 in /home/u552734802/domains/dailystocktopick.com/public_html/index.php on line 141
Warning: DOMDocument::loadHTML(): Unexpected end tag : a in Entity, line: 237 in /home/u552734802/domains/dailystocktopick.com/public_html/index.php on line 141
Warning: DOMDocument::loadHTML(): Unexpected end tag : a in Entity, line: 237 in /home/u552734802/domains/dailystocktopick.com/public_html/index.php on line 141
Warning: DOMDocument::loadHTML(): Unexpected end tag : a in Entity, line: 237 in /home/u552734802/domains/dailystocktopick.com/public_html/index.php on line 141
Warning: DOMDocument::loadHTML(): Unexpected end tag : a in Entity, line: 237 in /home/u552734802/domains/dailystocktopick.com/public_html/index.php on line 141
Warning: DOMDocument::loadHTML(): Unexpected end tag : a in Entity, line: 237 in /home/u552734802/domains/dailystocktopick.com/public_html/index.php on line 141
Warning: DOMDocument::loadHTML(): Unexpected end tag : div in Entity, line: 237 in /home/u552734802/domains/dailystocktopick.com/public_html/index.php on line 141
Warning: DOMDocument::loadHTML(): Unexpected end tag : li in Entity, line: 237 in /home/u552734802/domains/dailystocktopick.com/public_html/index.php on line 141
Warning: DOMDocument::loadHTML(): Unexpected end tag : div in Entity, line: 237 in /home/u552734802/domains/dailystocktopick.com/public_html/index.php on line 141
Warning: DOMDocument::loadHTML(): Unexpected end tag : a in Entity, line: 237 in /home/u552734802/domains/dailystocktopick.com/public_html/index.php on line 141
Warning: DOMDocument::loadHTML(): Unexpected end tag : a in Entity, line: 237 in /home/u552734802/domains/dailystocktopick.com/public_html/index.php on line 141
Warning: DOMDocument::loadHTML(): Unexpected end tag : a in Entity, line: 237 in /home/u552734802/domains/dailystocktopick.com/public_html/index.php on line 141
Warning: DOMDocument::loadHTML(): Unexpected end tag : a in Entity, line: 237 in /home/u552734802/domains/dailystocktopick.com/public_html/index.php on line 141
Warning: DOMDocument::loadHTML(): Unexpected end tag : a in Entity, line: 237 in /home/u552734802/domains/dailystocktopick.com/public_html/index.php on line 141
Warning: DOMDocument::loadHTML(): Unexpected end tag : a in Entity, line: 237 in /home/u552734802/domains/dailystocktopick.com/public_html/index.php on line 141
Warning: DOMDocument::loadHTML(): Unexpected end tag : a in Entity, line: 237 in /home/u552734802/domains/dailystocktopick.com/public_html/index.php on line 141
Warning: DOMDocument::loadHTML(): Unexpected end tag : a in Entity, line: 237 in /home/u552734802/domains/dailystocktopick.com/public_html/index.php on line 141
Warning: DOMDocument::loadHTML(): Unexpected end tag : a in Entity, line: 237 in /home/u552734802/domains/dailystocktopick.com/public_html/index.php on line 141
Warning: DOMDocument::loadHTML(): Unexpected end tag : a in Entity, line: 237 in /home/u552734802/domains/dailystocktopick.com/public_html/index.php on line 141
Warning: DOMDocument::loadHTML(): Unexpected end tag : a in Entity, line: 237 in /home/u552734802/domains/dailystocktopick.com/public_html/index.php on line 141
Warning: DOMDocument::loadHTML(): Unexpected end tag : a in Entity, line: 237 in /home/u552734802/domains/dailystocktopick.com/public_html/index.php on line 141
Warning: DOMDocument::loadHTML(): Unexpected end tag : a in Entity, line: 237 in /home/u552734802/domains/dailystocktopick.com/public_html/index.php on line 141
Warning: DOMDocument::loadHTML(): Unexpected end tag : a in Entity, line: 237 in /home/u552734802/domains/dailystocktopick.com/public_html/index.php on line 141
Warning: DOMDocument::loadHTML(): Unexpected end tag : a in Entity, line: 237 in /home/u552734802/domains/dailystocktopick.com/public_html/index.php on line 141
Warning: DOMDocument::loadHTML(): Unexpected end tag : div in Entity, line: 237 in /home/u552734802/domains/dailystocktopick.com/public_html/index.php on line 141
Warning: DOMDocument::loadHTML(): Unexpected end tag : li in Entity, line: 237 in /home/u552734802/domains/dailystocktopick.com/public_html/index.php on line 141
Warning: DOMDocument::loadHTML(): Unexpected end tag : div in Entity, line: 237 in /home/u552734802/domains/dailystocktopick.com/public_html/index.php on line 141
Warning: DOMDocument::loadHTML(): Unexpected end tag : a in Entity, line: 237 in /home/u552734802/domains/dailystocktopick.com/public_html/index.php on line 141
Warning: DOMDocument::loadHTML(): Unexpected end tag : a in Entity, line: 237 in /home/u552734802/domains/dailystocktopick.com/public_html/index.php on line 141
Warning: DOMDocument::loadHTML(): Unexpected end tag : a in Entity, line: 237 in /home/u552734802/domains/dailystocktopick.com/public_html/index.php on line 141
Warning: DOMDocument::loadHTML(): Unexpected end tag : a in Entity, line: 237 in /home/u552734802/domains/dailystocktopick.com/public_html/index.php on line 141
Warning: DOMDocument::loadHTML(): Unexpected end tag : a in Entity, line: 237 in /home/u552734802/domains/dailystocktopick.com/public_html/index.php on line 141
Warning: DOMDocument::loadHTML(): Unexpected end tag : a in Entity, line: 237 in /home/u552734802/domains/dailystocktopick.com/public_html/index.php on line 141
Warning: DOMDocument::loadHTML(): Unexpected end tag : a in Entity, line: 237 in /home/u552734802/domains/dailystocktopick.com/public_html/index.php on line 141
Warning: DOMDocument::loadHTML(): Unexpected end tag : a in Entity, line: 237 in /home/u552734802/domains/dailystocktopick.com/public_html/index.php on line 141
Warning: DOMDocument::loadHTML(): Unexpected end tag : a in Entity, line: 237 in /home/u552734802/domains/dailystocktopick.com/public_html/index.php on line 141
Warning: DOMDocument::loadHTML(): Unexpected end tag : a in Entity, line: 237 in /home/u552734802/domains/dailystocktopick.com/public_html/index.php on line 141
Warning: DOMDocument::loadHTML(): Unexpected end tag : a in Entity, line: 237 in /home/u552734802/domains/dailystocktopick.com/public_html/index.php on line 141
Warning: DOMDocument::loadHTML(): Unexpected end tag : a in Entity, line: 237 in /home/u552734802/domains/dailystocktopick.com/public_html/index.php on line 141
Warning: DOMDocument::loadHTML(): Unexpected end tag : a in Entity, line: 237 in /home/u552734802/domains/dailystocktopick.com/public_html/index.php on line 141
Warning: DOMDocument::loadHTML(): Unexpected end tag : a in Entity, line: 237 in /home/u552734802/domains/dailystocktopick.com/public_html/index.php on line 141
Warning: DOMDocument::loadHTML(): Unexpected end tag : a in Entity, line: 237 in /home/u552734802/domains/dailystocktopick.com/public_html/index.php on line 141
Warning: DOMDocument::loadHTML(): Unexpected end tag : a in Entity, line: 237 in /home/u552734802/domains/dailystocktopick.com/public_html/index.php on line 141
Warning: DOMDocument::loadHTML(): Unexpected end tag : a in Entity, line: 237 in /home/u552734802/domains/dailystocktopick.com/public_html/index.php on line 141
Warning: DOMDocument::loadHTML(): Unexpected end tag : div in Entity, line: 237 in /home/u552734802/domains/dailystocktopick.com/public_html/index.php on line 141
Warning: DOMDocument::loadHTML(): Unexpected end tag : li in Entity, line: 237 in /home/u552734802/domains/dailystocktopick.com/public_html/index.php on line 141
Warning: DOMDocument::loadHTML(): Unexpected end tag : div in Entity, line: 237 in /home/u552734802/domains/dailystocktopick.com/public_html/index.php on line 141
Warning: DOMDocument::loadHTML(): Unexpected end tag : a in Entity, line: 237 in /home/u552734802/domains/dailystocktopick.com/public_html/index.php on line 141
Warning: DOMDocument::loadHTML(): Unexpected end tag : a in Entity, line: 237 in /home/u552734802/domains/dailystocktopick.com/public_html/index.php on line 141
Warning: DOMDocument::loadHTML(): Unexpected end tag : a in Entity, line: 237 in /home/u552734802/domains/dailystocktopick.com/public_html/index.php on line 141
Warning: DOMDocument::loadHTML(): Unexpected end tag : a in Entity, line: 237 in /home/u552734802/domains/dailystocktopick.com/public_html/index.php on line 141
Warning: DOMDocument::loadHTML(): Unexpected end tag : a in Entity, line: 237 in /home/u552734802/domains/dailystocktopick.com/public_html/index.php on line 141
Warning: DOMDocument::loadHTML(): Unexpected end tag : a in Entity, line: 237 in /home/u552734802/domains/dailystocktopick.com/public_html/index.php on line 141
Warning: DOMDocument::loadHTML(): Unexpected end tag : a in Entity, line: 237 in /home/u552734802/domains/dailystocktopick.com/public_html/index.php on line 141
Warning: DOMDocument::loadHTML(): Unexpected end tag : a in Entity, line: 237 in /home/u552734802/domains/dailystocktopick.com/public_html/index.php on line 141
Warning: DOMDocument::loadHTML(): Unexpected end tag : a in Entity, line: 237 in /home/u552734802/domains/dailystocktopick.com/public_html/index.php on line 141
Warning: DOMDocument::loadHTML(): Unexpected end tag : a in Entity, line: 237 in /home/u552734802/domains/dailystocktopick.com/public_html/index.php on line 141
Warning: DOMDocument::loadHTML(): Unexpected end tag : a in Entity, line: 237 in /home/u552734802/domains/dailystocktopick.com/public_html/index.php on line 141
Warning: DOMDocument::loadHTML(): Unexpected end tag : a in Entity, line: 237 in /home/u552734802/domains/dailystocktopick.com/public_html/index.php on line 141
Warning: DOMDocument::loadHTML(): Unexpected end tag : a in Entity, line: 237 in /home/u552734802/domains/dailystocktopick.com/public_html/index.php on line 141
Warning: DOMDocument::loadHTML(): Unexpected end tag : div in Entity, line: 237 in /home/u552734802/domains/dailystocktopick.com/public_html/index.php on line 141
Warning: DOMDocument::loadHTML(): Unexpected end tag : li in Entity, line: 237 in /home/u552734802/domains/dailystocktopick.com/public_html/index.php on line 141
Warning: DOMDocument::loadHTML(): Unexpected end tag : ul in Entity, line: 237 in /home/u552734802/domains/dailystocktopick.com/public_html/index.php on line 141
Warning: DOMDocument::loadHTML(): Unexpected end tag : h2 in Entity, line: 252 in /home/u552734802/domains/dailystocktopick.com/public_html/index.php on line 141
Warning: DOMDocument::loadHTML(): Unexpected end tag : p in Entity, line: 253 in /home/u552734802/domains/dailystocktopick.com/public_html/index.php on line 141
Warning: DOMDocument::loadHTML(): Unexpected end tag : button in Entity, line: 256 in /home/u552734802/domains/dailystocktopick.com/public_html/index.php on line 141
Warning: DOMDocument::loadHTML(): Unexpected end tag : div in Entity, line: 257 in /home/u552734802/domains/dailystocktopick.com/public_html/index.php on line 141
Warning: DOMDocument::loadHTML(): Unexpected end tag : i in Entity, line: 237 in /home/u552734802/domains/dailystocktopick.com/public_html/index.php on line 141
Warning: DOMDocument::loadHTML(): Unexpected end tag : span in Entity, line: 237 in /home/u552734802/domains/dailystocktopick.com/public_html/index.php on line 141
Warning: DOMDocument::loadHTML(): Unexpected end tag : div in Entity, line: 237 in /home/u552734802/domains/dailystocktopick.com/public_html/index.php on line 141
Warning: DOMDocument::loadHTML(): Unexpected end tag : div in Entity, line: 237 in /home/u552734802/domains/dailystocktopick.com/public_html/index.php on line 141
Warning: DOMDocument::loadHTML(): Unexpected end tag : a in Entity, line: 237 in /home/u552734802/domains/dailystocktopick.com/public_html/index.php on line 141
Warning: DOMDocument::loadHTML(): Unexpected end tag : a in Entity, line: 237 in /home/u552734802/domains/dailystocktopick.com/public_html/index.php on line 141
Warning: DOMDocument::loadHTML(): Unexpected end tag : a in Entity, line: 237 in /home/u552734802/domains/dailystocktopick.com/public_html/index.php on line 141
Warning: DOMDocument::loadHTML(): Unexpected end tag : a in Entity, line: 237 in /home/u552734802/domains/dailystocktopick.com/public_html/index.php on line 141
Warning: DOMDocument::loadHTML(): Unexpected end tag : a in Entity, line: 237 in /home/u552734802/domains/dailystocktopick.com/public_html/index.php on line 141
Warning: DOMDocument::loadHTML(): Unexpected end tag : a in Entity, line: 237 in /home/u552734802/domains/dailystocktopick.com/public_html/index.php on line 141
Warning: DOMDocument::loadHTML(): Unexpected end tag : a in Entity, line: 237 in /home/u552734802/domains/dailystocktopick.com/public_html/index.php on line 141
Warning: DOMDocument::loadHTML(): Unexpected end tag : a in Entity, line: 237 in /home/u552734802/domains/dailystocktopick.com/public_html/index.php on line 141
Warning: DOMDocument::loadHTML(): Unexpected end tag : a in Entity, line: 237 in /home/u552734802/domains/dailystocktopick.com/public_html/index.php on line 141
Warning: DOMDocument::loadHTML(): Unexpected end tag : a in Entity, line: 237 in /home/u552734802/domains/dailystocktopick.com/public_html/index.php on line 141
Warning: DOMDocument::loadHTML(): Unexpected end tag : a in Entity, line: 237 in /home/u552734802/domains/dailystocktopick.com/public_html/index.php on line 141
Warning: DOMDocument::loadHTML(): Unexpected end tag : div in Entity, line: 237 in /home/u552734802/domains/dailystocktopick.com/public_html/index.php on line 141
Warning: DOMDocument::loadHTML(): Unexpected end tag : li in Entity, line: 237 in /home/u552734802/domains/dailystocktopick.com/public_html/index.php on line 141
Warning: DOMDocument::loadHTML(): Unexpected end tag : div in Entity, line: 237 in /home/u552734802/domains/dailystocktopick.com/public_html/index.php on line 141
Warning: DOMDocument::loadHTML(): Unexpected end tag : a in Entity, line: 237 in /home/u552734802/domains/dailystocktopick.com/public_html/index.php on line 141
Warning: DOMDocument::loadHTML(): Unexpected end tag : a in Entity, line: 237 in /home/u552734802/domains/dailystocktopick.com/public_html/index.php on line 141
Warning: DOMDocument::loadHTML(): Unexpected end tag : a in Entity, line: 237 in /home/u552734802/domains/dailystocktopick.com/public_html/index.php on line 141
Warning: DOMDocument::loadHTML(): Unexpected end tag : a in Entity, line: 237 in /home/u552734802/domains/dailystocktopick.com/public_html/index.php on line 141
Warning: DOMDocument::loadHTML(): Unexpected end tag : a in Entity, line: 237 in /home/u552734802/domains/dailystocktopick.com/public_html/index.php on line 141
Warning: DOMDocument::loadHTML(): Unexpected end tag : a in Entity, line: 237 in /home/u552734802/domains/dailystocktopick.com/public_html/index.php on line 141
Warning: DOMDocument::loadHTML(): Unexpected end tag : a in Entity, line: 237 in /home/u552734802/domains/dailystocktopick.com/public_html/index.php on line 141
Warning: DOMDocument::loadHTML(): Unexpected end tag : a in Entity, line: 237 in /home/u552734802/domains/dailystocktopick.com/public_html/index.php on line 141
Warning: DOMDocument::loadHTML(): Unexpected end tag : a in Entity, line: 237 in /home/u552734802/domains/dailystocktopick.com/public_html/index.php on line 141
Warning: DOMDocument::loadHTML(): Unexpected end tag : a in Entity, line: 237 in /home/u552734802/domains/dailystocktopick.com/public_html/index.php on line 141
Warning: DOMDocument::loadHTML(): Unexpected end tag : a in Entity, line: 237 in /home/u552734802/domains/dailystocktopick.com/public_html/index.php on line 141
Warning: DOMDocument::loadHTML(): Unexpected end tag : a in Entity, line: 237 in /home/u552734802/domains/dailystocktopick.com/public_html/index.php on line 141
Warning: DOMDocument::loadHTML(): Unexpected end tag : div in Entity, line: 237 in /home/u552734802/domains/dailystocktopick.com/public_html/index.php on line 141
Warning: DOMDocument::loadHTML(): Unexpected end tag : li in Entity, line: 237 in /home/u552734802/domains/dailystocktopick.com/public_html/index.php on line 141
Warning: DOMDocument::loadHTML(): Unexpected end tag : div in Entity, line: 237 in /home/u552734802/domains/dailystocktopick.com/public_html/index.php on line 141
Warning: DOMDocument::loadHTML(): Unexpected end tag : a in Entity, line: 237 in /home/u552734802/domains/dailystocktopick.com/public_html/index.php on line 141
Warning: DOMDocument::loadHTML(): Unexpected end tag : a in Entity, line: 237 in /home/u552734802/domains/dailystocktopick.com/public_html/index.php on line 141
Warning: DOMDocument::loadHTML(): Unexpected end tag : a in Entity, line: 237 in /home/u552734802/domains/dailystocktopick.com/public_html/index.php on line 141
Warning: DOMDocument::loadHTML(): Unexpected end tag : a in Entity, line: 237 in /home/u552734802/domains/dailystocktopick.com/public_html/index.php on line 141
Warning: DOMDocument::loadHTML(): Unexpected end tag : a in Entity, line: 237 in /home/u552734802/domains/dailystocktopick.com/public_html/index.php on line 141
Warning: DOMDocument::loadHTML(): Unexpected end tag : a in Entity, line: 237 in /home/u552734802/domains/dailystocktopick.com/public_html/index.php on line 141
Warning: DOMDocument::loadHTML(): Unexpected end tag : a in Entity, line: 237 in /home/u552734802/domains/dailystocktopick.com/public_html/index.php on line 141
Warning: DOMDocument::loadHTML(): Unexpected end tag : a in Entity, line: 237 in /home/u552734802/domains/dailystocktopick.com/public_html/index.php on line 141
Warning: DOMDocument::loadHTML(): Unexpected end tag : div in Entity, line: 237 in /home/u552734802/domains/dailystocktopick.com/public_html/index.php on line 141
Warning: DOMDocument::loadHTML(): Unexpected end tag : li in Entity, line: 237 in /home/u552734802/domains/dailystocktopick.com/public_html/index.php on line 141
Warning: DOMDocument::loadHTML(): Unexpected end tag : div in Entity, line: 237 in /home/u552734802/domains/dailystocktopick.com/public_html/index.php on line 141
Warning: DOMDocument::loadHTML(): Unexpected end tag : a in Entity, line: 237 in /home/u552734802/domains/dailystocktopick.com/public_html/index.php on line 141
Warning: DOMDocument::loadHTML(): Unexpected end tag : a in Entity, line: 237 in /home/u552734802/domains/dailystocktopick.com/public_html/index.php on line 141
Warning: DOMDocument::loadHTML(): Unexpected end tag : a in Entity, line: 237 in /home/u552734802/domains/dailystocktopick.com/public_html/index.php on line 141
Warning: DOMDocument::loadHTML(): Unexpected end tag : a in Entity, line: 237 in /home/u552734802/domains/dailystocktopick.com/public_html/index.php on line 141
Warning: DOMDocument::loadHTML(): Unexpected end tag : a in Entity, line: 237 in /home/u552734802/domains/dailystocktopick.com/public_html/index.php on line 141
Warning: DOMDocument::loadHTML(): Unexpected end tag : a in Entity, line: 237 in /home/u552734802/domains/dailystocktopick.com/public_html/index.php on line 141
Warning: DOMDocument::loadHTML(): Unexpected end tag : a in Entity, line: 237 in /home/u552734802/domains/dailystocktopick.com/public_html/index.php on line 141
Warning: DOMDocument::loadHTML(): Unexpected end tag : a in Entity, line: 237 in /home/u552734802/domains/dailystocktopick.com/public_html/index.php on line 141
Warning: DOMDocument::loadHTML(): Unexpected end tag : a in Entity, line: 237 in /home/u552734802/domains/dailystocktopick.com/public_html/index.php on line 141
Warning: DOMDocument::loadHTML(): Unexpected end tag : a in Entity, line: 237 in /home/u552734802/domains/dailystocktopick.com/public_html/index.php on line 141
Warning: DOMDocument::loadHTML(): Unexpected end tag : a in Entity, line: 237 in /home/u552734802/domains/dailystocktopick.com/public_html/index.php on line 141
Warning: DOMDocument::loadHTML(): Unexpected end tag : a in Entity, line: 237 in /home/u552734802/domains/dailystocktopick.com/public_html/index.php on line 141
Warning: DOMDocument::loadHTML(): Unexpected end tag : div in Entity, line: 237 in /home/u552734802/domains/dailystocktopick.com/public_html/index.php on line 141
Warning: DOMDocument::loadHTML(): Unexpected end tag : li in Entity, line: 237 in /home/u552734802/domains/dailystocktopick.com/public_html/index.php on line 141
Warning: DOMDocument::loadHTML(): Unexpected end tag : div in Entity, line: 237 in /home/u552734802/domains/dailystocktopick.com/public_html/index.php on line 141
Warning: DOMDocument::loadHTML(): Unexpected end tag : a in Entity, line: 237 in /home/u552734802/domains/dailystocktopick.com/public_html/index.php on line 141
Warning: DOMDocument::loadHTML(): Unexpected end tag : a in Entity, line: 237 in /home/u552734802/domains/dailystocktopick.com/public_html/index.php on line 141
Warning: DOMDocument::loadHTML(): Unexpected end tag : a in Entity, line: 237 in /home/u552734802/domains/dailystocktopick.com/public_html/index.php on line 141
Warning: DOMDocument::loadHTML(): Unexpected end tag : a in Entity, line: 237 in /home/u552734802/domains/dailystocktopick.com/public_html/index.php on line 141
Warning: DOMDocument::loadHTML(): Unexpected end tag : a in Entity, line: 237 in /home/u552734802/domains/dailystocktopick.com/public_html/index.php on line 141
Warning: DOMDocument::loadHTML(): Unexpected end tag : a in Entity, line: 237 in /home/u552734802/domains/dailystocktopick.com/public_html/index.php on line 141
Warning: DOMDocument::loadHTML(): Unexpected end tag : div in Entity, line: 237 in /home/u552734802/domains/dailystocktopick.com/public_html/index.php on line 141
Warning: DOMDocument::loadHTML(): Unexpected end tag : li in Entity, line: 237 in /home/u552734802/domains/dailystocktopick.com/public_html/index.php on line 141
Warning: DOMDocument::loadHTML(): Unexpected end tag : div in Entity, line: 237 in /home/u552734802/domains/dailystocktopick.com/public_html/index.php on line 141
Warning: DOMDocument::loadHTML(): Unexpected end tag : a in Entity, line: 237 in /home/u552734802/domains/dailystocktopick.com/public_html/index.php on line 141
Warning: DOMDocument::loadHTML(): Unexpected end tag : a in Entity, line: 237 in /home/u552734802/domains/dailystocktopick.com/public_html/index.php on line 141
Warning: DOMDocument::loadHTML(): Unexpected end tag : a in Entity, line: 237 in /home/u552734802/domains/dailystocktopick.com/public_html/index.php on line 141
Warning: DOMDocument::loadHTML(): Unexpected end tag : a in Entity, line: 237 in /home/u552734802/domains/dailystocktopick.com/public_html/index.php on line 141
Warning: DOMDocument::loadHTML(): Unexpected end tag : a in Entity, line: 237 in /home/u552734802/domains/dailystocktopick.com/public_html/index.php on line 141
Warning: DOMDocument::loadHTML(): Unexpected end tag : a in Entity, line: 237 in /home/u552734802/domains/dailystocktopick.com/public_html/index.php on line 141
Warning: DOMDocument::loadHTML(): Unexpected end tag : a in Entity, line: 237 in /home/u552734802/domains/dailystocktopick.com/public_html/index.php on line 141
Warning: DOMDocument::loadHTML(): Unexpected end tag : a in Entity, line: 237 in /home/u552734802/domains/dailystocktopick.com/public_html/index.php on line 141
Warning: DOMDocument::loadHTML(): Unexpected end tag : a in Entity, line: 237 in /home/u552734802/domains/dailystocktopick.com/public_html/index.php on line 141
Warning: DOMDocument::loadHTML(): Unexpected end tag : a in Entity, line: 237 in /home/u552734802/domains/dailystocktopick.com/public_html/index.php on line 141
Warning: DOMDocument::loadHTML(): Unexpected end tag : a in Entity, line: 237 in /home/u552734802/domains/dailystocktopick.com/public_html/index.php on line 141
Warning: DOMDocument::loadHTML(): Unexpected end tag : a in Entity, line: 237 in /home/u552734802/domains/dailystocktopick.com/public_html/index.php on line 141
Warning: DOMDocument::loadHTML(): Unexpected end tag : a in Entity, line: 237 in /home/u552734802/domains/dailystocktopick.com/public_html/index.php on line 141
Warning: DOMDocument::loadHTML(): Unexpected end tag : a in Entity, line: 237 in /home/u552734802/domains/dailystocktopick.com/public_html/index.php on line 141
Warning: DOMDocument::loadHTML(): Unexpected end tag : a in Entity, line: 237 in /home/u552734802/domains/dailystocktopick.com/public_html/index.php on line 141
Warning: DOMDocument::loadHTML(): Unexpected end tag : a in Entity, line: 237 in /home/u552734802/domains/dailystocktopick.com/public_html/index.php on line 141
Warning: DOMDocument::loadHTML(): Unexpected end tag : a in Entity, line: 237 in /home/u552734802/domains/dailystocktopick.com/public_html/index.php on line 141
Warning: DOMDocument::loadHTML(): Unexpected end tag : a in Entity, line: 237 in /home/u552734802/domains/dailystocktopick.com/public_html/index.php on line 141
Warning: DOMDocument::loadHTML(): Unexpected end tag : div in Entity, line: 237 in /home/u552734802/domains/dailystocktopick.com/public_html/index.php on line 141
Warning: DOMDocument::loadHTML(): Unexpected end tag : li in Entity, line: 237 in /home/u552734802/domains/dailystocktopick.com/public_html/index.php on line 141
Warning: DOMDocument::loadHTML(): Unexpected end tag : div in Entity, line: 237 in /home/u552734802/domains/dailystocktopick.com/public_html/index.php on line 141
Warning: DOMDocument::loadHTML(): Unexpected end tag : a in Entity, line: 237 in /home/u552734802/domains/dailystocktopick.com/public_html/index.php on line 141
Warning: DOMDocument::loadHTML(): Unexpected end tag : a in Entity, line: 237 in /home/u552734802/domains/dailystocktopick.com/public_html/index.php on line 141
Warning: DOMDocument::loadHTML(): Unexpected end tag : a in Entity, line: 237 in /home/u552734802/domains/dailystocktopick.com/public_html/index.php on line 141
Warning: DOMDocument::loadHTML(): Unexpected end tag : a in Entity, line: 237 in /home/u552734802/domains/dailystocktopick.com/public_html/index.php on line 141
Warning: DOMDocument::loadHTML(): Unexpected end tag : a in Entity, line: 237 in /home/u552734802/domains/dailystocktopick.com/public_html/index.php on line 141
Warning: DOMDocument::loadHTML(): Unexpected end tag : a in Entity, line: 237 in /home/u552734802/domains/dailystocktopick.com/public_html/index.php on line 141
Warning: DOMDocument::loadHTML(): Unexpected end tag : a in Entity, line: 237 in /home/u552734802/domains/dailystocktopick.com/public_html/index.php on line 141
Warning: DOMDocument::loadHTML(): Unexpected end tag : a in Entity, line: 237 in /home/u552734802/domains/dailystocktopick.com/public_html/index.php on line 141
Warning: DOMDocument::loadHTML(): Unexpected end tag : a in Entity, line: 237 in /home/u552734802/domains/dailystocktopick.com/public_html/index.php on line 141
Warning: DOMDocument::loadHTML(): Unexpected end tag : a in Entity, line: 237 in /home/u552734802/domains/dailystocktopick.com/public_html/index.php on line 141
Warning: DOMDocument::loadHTML(): Unexpected end tag : a in Entity, line: 237 in /home/u552734802/domains/dailystocktopick.com/public_html/index.php on line 141
Warning: DOMDocument::loadHTML(): Unexpected end tag : a in Entity, line: 237 in /home/u552734802/domains/dailystocktopick.com/public_html/index.php on line 141
Warning: DOMDocument::loadHTML(): Unexpected end tag : a in Entity, line: 237 in /home/u552734802/domains/dailystocktopick.com/public_html/index.php on line 141
Warning: DOMDocument::loadHTML(): Unexpected end tag : a in Entity, line: 237 in /home/u552734802/domains/dailystocktopick.com/public_html/index.php on line 141
Warning: DOMDocument::loadHTML(): Unexpected end tag : a in Entity, line: 237 in /home/u552734802/domains/dailystocktopick.com/public_html/index.php on line 141
Warning: DOMDocument::loadHTML(): Unexpected end tag : div in Entity, line: 237 in /home/u552734802/domains/dailystocktopick.com/public_html/index.php on line 141
Warning: DOMDocument::loadHTML(): Unexpected end tag : li in Entity, line: 237 in /home/u552734802/domains/dailystocktopick.com/public_html/index.php on line 141
Warning: DOMDocument::loadHTML(): Unexpected end tag : div in Entity, line: 237 in /home/u552734802/domains/dailystocktopick.com/public_html/index.php on line 141
Warning: DOMDocument::loadHTML(): Unexpected end tag : a in Entity, line: 237 in /home/u552734802/domains/dailystocktopick.com/public_html/index.php on line 141
Warning: DOMDocument::loadHTML(): Unexpected end tag : a in Entity, line: 237 in /home/u552734802/domains/dailystocktopick.com/public_html/index.php on line 141
Warning: DOMDocument::loadHTML(): Unexpected end tag : a in Entity, line: 237 in /home/u552734802/domains/dailystocktopick.com/public_html/index.php on line 141
Warning: DOMDocument::loadHTML(): Unexpected end tag : a in Entity, line: 237 in /home/u552734802/domains/dailystocktopick.com/public_html/index.php on line 141
Warning: DOMDocument::loadHTML(): Unexpected end tag : a in Entity, line: 237 in /home/u552734802/domains/dailystocktopick.com/public_html/index.php on line 141
Warning: DOMDocument::loadHTML(): Unexpected end tag : a in Entity, line: 237 in /home/u552734802/domains/dailystocktopick.com/public_html/index.php on line 141
Warning: DOMDocument::loadHTML(): Unexpected end tag : a in Entity, line: 237 in /home/u552734802/domains/dailystocktopick.com/public_html/index.php on line 141
Warning: DOMDocument::loadHTML(): Unexpected end tag : a in Entity, line: 237 in /home/u552734802/domains/dailystocktopick.com/public_html/index.php on line 141
Warning: DOMDocument::loadHTML(): Unexpected end tag : a in Entity, line: 237 in /home/u552734802/domains/dailystocktopick.com/public_html/index.php on line 141
Warning: DOMDocument::loadHTML(): Unexpected end tag : a in Entity, line: 237 in /home/u552734802/domains/dailystocktopick.com/public_html/index.php on line 141
Warning: DOMDocument::loadHTML(): Unexpected end tag : a in Entity, line: 237 in /home/u552734802/domains/dailystocktopick.com/public_html/index.php on line 141
Warning: DOMDocument::loadHTML(): Unexpected end tag : a in Entity, line: 237 in /home/u552734802/domains/dailystocktopick.com/public_html/index.php on line 141
Warning: DOMDocument::loadHTML(): Unexpected end tag : a in Entity, line: 237 in /home/u552734802/domains/dailystocktopick.com/public_html/index.php on line 141
Warning: DOMDocument::loadHTML(): Unexpected end tag : div in Entity, line: 237 in /home/u552734802/domains/dailystocktopick.com/public_html/index.php on line 141
Warning: DOMDocument::loadHTML(): Unexpected end tag : li in Entity, line: 237 in /home/u552734802/domains/dailystocktopick.com/public_html/index.php on line 141
Warning: DOMDocument::loadHTML(): Unexpected end tag : div in Entity, line: 237 in /home/u552734802/domains/dailystocktopick.com/public_html/index.php on line 141
Warning: DOMDocument::loadHTML(): Unexpected end tag : a in Entity, line: 237 in /home/u552734802/domains/dailystocktopick.com/public_html/index.php on line 141
Warning: DOMDocument::loadHTML(): Unexpected end tag : a in Entity, line: 237 in /home/u552734802/domains/dailystocktopick.com/public_html/index.php on line 141
Warning: DOMDocument::loadHTML(): Unexpected end tag : a in Entity, line: 237 in /home/u552734802/domains/dailystocktopick.com/public_html/index.php on line 141
Warning: DOMDocument::loadHTML(): Unexpected end tag : a in Entity, line: 237 in /home/u552734802/domains/dailystocktopick.com/public_html/index.php on line 141
Warning: DOMDocument::loadHTML(): Unexpected end tag : a in Entity, line: 237 in /home/u552734802/domains/dailystocktopick.com/public_html/index.php on line 141
Warning: DOMDocument::loadHTML(): Unexpected end tag : a in Entity, line: 237 in /home/u552734802/domains/dailystocktopick.com/public_html/index.php on line 141
Warning: DOMDocument::loadHTML(): Unexpected end tag : a in Entity, line: 237 in /home/u552734802/domains/dailystocktopick.com/public_html/index.php on line 141
Warning: DOMDocument::loadHTML(): Unexpected end tag : a in Entity, line: 237 in /home/u552734802/domains/dailystocktopick.com/public_html/index.php on line 141
Warning: DOMDocument::loadHTML(): Unexpected end tag : a in Entity, line: 237 in /home/u552734802/domains/dailystocktopick.com/public_html/index.php on line 141
Warning: DOMDocument::loadHTML(): Unexpected end tag : a in Entity, line: 237 in /home/u552734802/domains/dailystocktopick.com/public_html/index.php on line 141
Warning: DOMDocument::loadHTML(): Unexpected end tag : a in Entity, line: 237 in /home/u552734802/domains/dailystocktopick.com/public_html/index.php on line 141
Warning: DOMDocument::loadHTML(): Unexpected end tag : a in Entity, line: 237 in /home/u552734802/domains/dailystocktopick.com/public_html/index.php on line 141
Warning: DOMDocument::loadHTML(): Unexpected end tag : a in Entity, line: 237 in /home/u552734802/domains/dailystocktopick.com/public_html/index.php on line 141
Warning: DOMDocument::loadHTML(): Unexpected end tag : a in Entity, line: 237 in /home/u552734802/domains/dailystocktopick.com/public_html/index.php on line 141
Warning: DOMDocument::loadHTML(): Unexpected end tag : a in Entity, line: 237 in /home/u552734802/domains/dailystocktopick.com/public_html/index.php on line 141
Warning: DOMDocument::loadHTML(): Unexpected end tag : a in Entity, line: 237 in /home/u552734802/domains/dailystocktopick.com/public_html/index.php on line 141
Warning: DOMDocument::loadHTML(): Unexpected end tag : div in Entity, line: 237 in /home/u552734802/domains/dailystocktopick.com/public_html/index.php on line 141
Warning: DOMDocument::loadHTML(): Unexpected end tag : li in Entity, line: 237 in /home/u552734802/domains/dailystocktopick.com/public_html/index.php on line 141
Warning: DOMDocument::loadHTML(): Unexpected end tag : div in Entity, line: 237 in /home/u552734802/domains/dailystocktopick.com/public_html/index.php on line 141
Warning: DOMDocument::loadHTML(): Unexpected end tag : a in Entity, line: 237 in /home/u552734802/domains/dailystocktopick.com/public_html/index.php on line 141
Warning: DOMDocument::loadHTML(): Unexpected end tag : a in Entity, line: 237 in /home/u552734802/domains/dailystocktopick.com/public_html/index.php on line 141
Warning: DOMDocument::loadHTML(): Unexpected end tag : a in Entity, line: 237 in /home/u552734802/domains/dailystocktopick.com/public_html/index.php on line 141
Warning: DOMDocument::loadHTML(): Unexpected end tag : a in Entity, line: 237 in /home/u552734802/domains/dailystocktopick.com/public_html/index.php on line 141
Warning: DOMDocument::loadHTML(): Unexpected end tag : a in Entity, line: 237 in /home/u552734802/domains/dailystocktopick.com/public_html/index.php on line 141
Warning: DOMDocument::loadHTML(): Unexpected end tag : a in Entity, line: 237 in /home/u552734802/domains/dailystocktopick.com/public_html/index.php on line 141
Warning: DOMDocument::loadHTML(): Unexpected end tag : a in Entity, line: 237 in /home/u552734802/domains/dailystocktopick.com/public_html/index.php on line 141
Warning: DOMDocument::loadHTML(): Unexpected end tag : a in Entity, line: 237 in /home/u552734802/domains/dailystocktopick.com/public_html/index.php on line 141
Warning: DOMDocument::loadHTML(): Unexpected end tag : a in Entity, line: 237 in /home/u552734802/domains/dailystocktopick.com/public_html/index.php on line 141
Warning: DOMDocument::loadHTML(): Unexpected end tag : a in Entity, line: 237 in /home/u552734802/domains/dailystocktopick.com/public_html/index.php on line 141
Warning: DOMDocument::loadHTML(): Unexpected end tag : a in Entity, line: 237 in /home/u552734802/domains/dailystocktopick.com/public_html/index.php on line 141
Warning: DOMDocument::loadHTML(): Unexpected end tag : a in Entity, line: 237 in /home/u552734802/domains/dailystocktopick.com/public_html/index.php on line 141
Warning: DOMDocument::loadHTML(): Unexpected end tag : a in Entity, line: 237 in /home/u552734802/domains/dailystocktopick.com/public_html/index.php on line 141
Warning: DOMDocument::loadHTML(): Unexpected end tag : a in Entity, line: 237 in /home/u552734802/domains/dailystocktopick.com/public_html/index.php on line 141
Warning: DOMDocument::loadHTML(): Unexpected end tag : a in Entity, line: 237 in /home/u552734802/domains/dailystocktopick.com/public_html/index.php on line 141
Warning: DOMDocument::loadHTML(): Unexpected end tag : a in Entity, line: 237 in /home/u552734802/domains/dailystocktopick.com/public_html/index.php on line 141
Warning: DOMDocument::loadHTML(): Unexpected end tag : div in Entity, line: 237 in /home/u552734802/domains/dailystocktopick.com/public_html/index.php on line 141
Warning: DOMDocument::loadHTML(): Unexpected end tag : li in Entity, line: 237 in /home/u552734802/domains/dailystocktopick.com/public_html/index.php on line 141
Warning: DOMDocument::loadHTML(): Unexpected end tag : div in Entity, line: 237 in /home/u552734802/domains/dailystocktopick.com/public_html/index.php on line 141
Warning: DOMDocument::loadHTML(): Unexpected end tag : a in Entity, line: 237 in /home/u552734802/domains/dailystocktopick.com/public_html/index.php on line 141
Warning: DOMDocument::loadHTML(): Unexpected end tag : a in Entity, line: 237 in /home/u552734802/domains/dailystocktopick.com/public_html/index.php on line 141
Warning: DOMDocument::loadHTML(): Unexpected end tag : a in Entity, line: 237 in /home/u552734802/domains/dailystocktopick.com/public_html/index.php on line 141
Warning: DOMDocument::loadHTML(): Unexpected end tag : a in Entity, line: 237 in /home/u552734802/domains/dailystocktopick.com/public_html/index.php on line 141
Warning: DOMDocument::loadHTML(): Unexpected end tag : a in Entity, line: 237 in /home/u552734802/domains/dailystocktopick.com/public_html/index.php on line 141
Warning: DOMDocument::loadHTML(): Unexpected end tag : a in Entity, line: 237 in /home/u552734802/domains/dailystocktopick.com/public_html/index.php on line 141
Warning: DOMDocument::loadHTML(): Unexpected end tag : a in Entity, line: 237 in /home/u552734802/domains/dailystocktopick.com/public_html/index.php on line 141
Warning: DOMDocument::loadHTML(): Unexpected end tag : a in Entity, line: 237 in /home/u552734802/domains/dailystocktopick.com/public_html/index.php on line 141
Warning: DOMDocument::loadHTML(): Unexpected end tag : a in Entity, line: 237 in /home/u552734802/domains/dailystocktopick.com/public_html/index.php on line 141
Warning: DOMDocument::loadHTML(): Unexpected end tag : a in Entity, line: 237 in /home/u552734802/domains/dailystocktopick.com/public_html/index.php on line 141
Warning: DOMDocument::loadHTML(): Unexpected end tag : a in Entity, line: 237 in /home/u552734802/domains/dailystocktopick.com/public_html/index.php on line 141
Warning: DOMDocument::loadHTML(): Unexpected end tag : a in Entity, line: 237 in /home/u552734802/domains/dailystocktopick.com/public_html/index.php on line 141
Warning: DOMDocument::loadHTML(): Unexpected end tag : a in Entity, line: 237 in /home/u552734802/domains/dailystocktopick.com/public_html/index.php on line 141
Warning: DOMDocument::loadHTML(): Unexpected end tag : a in Entity, line: 237 in /home/u552734802/domains/dailystocktopick.com/public_html/index.php on line 141
Warning: DOMDocument::loadHTML(): Unexpected end tag : a in Entity, line: 237 in /home/u552734802/domains/dailystocktopick.com/public_html/index.php on line 141
Warning: DOMDocument::loadHTML(): Unexpected end tag : a in Entity, line: 237 in /home/u552734802/domains/dailystocktopick.com/public_html/index.php on line 141
Warning: DOMDocument::loadHTML(): Unexpected end tag : a in Entity, line: 237 in /home/u552734802/domains/dailystocktopick.com/public_html/index.php on line 141
Warning: DOMDocument::loadHTML(): Unexpected end tag : a in Entity, line: 237 in /home/u552734802/domains/dailystocktopick.com/public_html/index.php on line 141
Warning: DOMDocument::loadHTML(): Unexpected end tag : div in Entity, line: 237 in /home/u552734802/domains/dailystocktopick.com/public_html/index.php on line 141
Warning: DOMDocument::loadHTML(): Unexpected end tag : li in Entity, line: 237 in /home/u552734802/domains/dailystocktopick.com/public_html/index.php on line 141
Warning: DOMDocument::loadHTML(): Unexpected end tag : div in Entity, line: 237 in /home/u552734802/domains/dailystocktopick.com/public_html/index.php on line 141
Warning: DOMDocument::loadHTML(): Unexpected end tag : a in Entity, line: 237 in /home/u552734802/domains/dailystocktopick.com/public_html/index.php on line 141
Warning: DOMDocument::loadHTML(): Unexpected end tag : a in Entity, line: 237 in /home/u552734802/domains/dailystocktopick.com/public_html/index.php on line 141
Warning: DOMDocument::loadHTML(): Unexpected end tag : a in Entity, line: 237 in /home/u552734802/domains/dailystocktopick.com/public_html/index.php on line 141
Warning: DOMDocument::loadHTML(): Unexpected end tag : a in Entity, line: 237 in /home/u552734802/domains/dailystocktopick.com/public_html/index.php on line 141
Warning: DOMDocument::loadHTML(): Unexpected end tag : a in Entity, line: 237 in /home/u552734802/domains/dailystocktopick.com/public_html/index.php on line 141
Warning: DOMDocument::loadHTML(): Unexpected end tag : a in Entity, line: 237 in /home/u552734802/domains/dailystocktopick.com/public_html/index.php on line 141
Warning: DOMDocument::loadHTML(): Unexpected end tag : a in Entity, line: 237 in /home/u552734802/domains/dailystocktopick.com/public_html/index.php on line 141
Warning: DOMDocument::loadHTML(): Unexpected end tag : a in Entity, line: 237 in /home/u552734802/domains/dailystocktopick.com/public_html/index.php on line 141
Warning: DOMDocument::loadHTML(): Unexpected end tag : a in Entity, line: 237 in /home/u552734802/domains/dailystocktopick.com/public_html/index.php on line 141
Warning: DOMDocument::loadHTML(): Unexpected end tag : a in Entity, line: 237 in /home/u552734802/domains/dailystocktopick.com/public_html/index.php on line 141
Warning: DOMDocument::loadHTML(): Unexpected end tag : div in Entity, line: 237 in /home/u552734802/domains/dailystocktopick.com/public_html/index.php on line 141
Warning: DOMDocument::loadHTML(): Unexpected end tag : li in Entity, line: 237 in /home/u552734802/domains/dailystocktopick.com/public_html/index.php on line 141
Warning: DOMDocument::loadHTML(): Unexpected end tag : div in Entity, line: 237 in /home/u552734802/domains/dailystocktopick.com/public_html/index.php on line 141
Warning: DOMDocument::loadHTML(): Unexpected end tag : a in Entity, line: 237 in /home/u552734802/domains/dailystocktopick.com/public_html/index.php on line 141
Warning: DOMDocument::loadHTML(): Unexpected end tag : a in Entity, line: 237 in /home/u552734802/domains/dailystocktopick.com/public_html/index.php on line 141
Warning: DOMDocument::loadHTML(): Unexpected end tag : a in Entity, line: 237 in /home/u552734802/domains/dailystocktopick.com/public_html/index.php on line 141
Warning: DOMDocument::loadHTML(): Unexpected end tag : a in Entity, line: 237 in /home/u552734802/domains/dailystocktopick.com/public_html/index.php on line 141
Warning: DOMDocument::loadHTML(): Unexpected end tag : a in Entity, line: 237 in /home/u552734802/domains/dailystocktopick.com/public_html/index.php on line 141
Warning: DOMDocument::loadHTML(): Unexpected end tag : a in Entity, line: 237 in /home/u552734802/domains/dailystocktopick.com/public_html/index.php on line 141
Warning: DOMDocument::loadHTML(): Unexpected end tag : a in Entity, line: 237 in /home/u552734802/domains/dailystocktopick.com/public_html/index.php on line 141
Warning: DOMDocument::loadHTML(): Unexpected end tag : a in Entity, line: 237 in /home/u552734802/domains/dailystocktopick.com/public_html/index.php on line 141
Warning: DOMDocument::loadHTML(): Unexpected end tag : a in Entity, line: 237 in /home/u552734802/domains/dailystocktopick.com/public_html/index.php on line 141
Warning: DOMDocument::loadHTML(): Unexpected end tag : a in Entity, line: 237 in /home/u552734802/domains/dailystocktopick.com/public_html/index.php on line 141
Warning: DOMDocument::loadHTML(): Unexpected end tag : div in Entity, line: 237 in /home/u552734802/domains/dailystocktopick.com/public_html/index.php on line 141
Warning: DOMDocument::loadHTML(): Unexpected end tag : li in Entity, line: 237 in /home/u552734802/domains/dailystocktopick.com/public_html/index.php on line 141
Warning: DOMDocument::loadHTML(): Unexpected end tag : div in Entity, line: 237 in /home/u552734802/domains/dailystocktopick.com/public_html/index.php on line 141
Warning: DOMDocument::loadHTML(): Unexpected end tag : a in Entity, line: 237 in /home/u552734802/domains/dailystocktopick.com/public_html/index.php on line 141
Warning: DOMDocument::loadHTML(): Unexpected end tag : a in Entity, line: 237 in /home/u552734802/domains/dailystocktopick.com/public_html/index.php on line 141
Warning: DOMDocument::loadHTML(): Unexpected end tag : a in Entity, line: 237 in /home/u552734802/domains/dailystocktopick.com/public_html/index.php on line 141
Warning: DOMDocument::loadHTML(): Unexpected end tag : a in Entity, line: 237 in /home/u552734802/domains/dailystocktopick.com/public_html/index.php on line 141
Warning: DOMDocument::loadHTML(): Unexpected end tag : a in Entity, line: 237 in /home/u552734802/domains/dailystocktopick.com/public_html/index.php on line 141
Warning: DOMDocument::loadHTML(): Unexpected end tag : a in Entity, line: 237 in /home/u552734802/domains/dailystocktopick.com/public_html/index.php on line 141
Warning: DOMDocument::loadHTML(): Unexpected end tag : a in Entity, line: 237 in /home/u552734802/domains/dailystocktopick.com/public_html/index.php on line 141
Warning: DOMDocument::loadHTML(): Unexpected end tag : a in Entity, line: 237 in /home/u552734802/domains/dailystocktopick.com/public_html/index.php on line 141
Warning: DOMDocument::loadHTML(): Unexpected end tag : a in Entity, line: 237 in /home/u552734802/domains/dailystocktopick.com/public_html/index.php on line 141
Warning: DOMDocument::loadHTML(): Unexpected end tag : a in Entity, line: 237 in /home/u552734802/domains/dailystocktopick.com/public_html/index.php on line 141
Warning: DOMDocument::loadHTML(): Unexpected end tag : a in Entity, line: 237 in /home/u552734802/domains/dailystocktopick.com/public_html/index.php on line 141
Warning: DOMDocument::loadHTML(): Unexpected end tag : div in Entity, line: 237 in /home/u552734802/domains/dailystocktopick.com/public_html/index.php on line 141
Warning: DOMDocument::loadHTML(): Unexpected end tag : li in Entity, line: 237 in /home/u552734802/domains/dailystocktopick.com/public_html/index.php on line 141
Warning: DOMDocument::loadHTML(): Unexpected end tag : div in Entity, line: 237 in /home/u552734802/domains/dailystocktopick.com/public_html/index.php on line 141
Warning: DOMDocument::loadHTML(): Unexpected end tag : a in Entity, line: 237 in /home/u552734802/domains/dailystocktopick.com/public_html/index.php on line 141
Warning: DOMDocument::loadHTML(): Unexpected end tag : a in Entity, line: 237 in /home/u552734802/domains/dailystocktopick.com/public_html/index.php on line 141
Warning: DOMDocument::loadHTML(): Unexpected end tag : a in Entity, line: 237 in /home/u552734802/domains/dailystocktopick.com/public_html/index.php on line 141
Warning: DOMDocument::loadHTML(): Unexpected end tag : a in Entity, line: 237 in /home/u552734802/domains/dailystocktopick.com/public_html/index.php on line 141
Warning: DOMDocument::loadHTML(): Unexpected end tag : a in Entity, line: 237 in /home/u552734802/domains/dailystocktopick.com/public_html/index.php on line 141
Warning: DOMDocument::loadHTML(): Unexpected end tag : a in Entity, line: 237 in /home/u552734802/domains/dailystocktopick.com/public_html/index.php on line 141
Warning: DOMDocument::loadHTML(): Unexpected end tag : a in Entity, line: 237 in /home/u552734802/domains/dailystocktopick.com/public_html/index.php on line 141
Warning: DOMDocument::loadHTML(): Unexpected end tag : a in Entity, line: 237 in /home/u552734802/domains/dailystocktopick.com/public_html/index.php on line 141
Warning: DOMDocument::loadHTML(): Unexpected end tag : a in Entity, line: 237 in /home/u552734802/domains/dailystocktopick.com/public_html/index.php on line 141
Warning: DOMDocument::loadHTML(): Unexpected end tag : a in Entity, line: 237 in /home/u552734802/domains/dailystocktopick.com/public_html/index.php on line 141
Warning: DOMDocument::loadHTML(): Unexpected end tag : a in Entity, line: 237 in /home/u552734802/domains/dailystocktopick.com/public_html/index.php on line 141
Warning: DOMDocument::loadHTML(): Unexpected end tag : a in Entity, line: 237 in /home/u552734802/domains/dailystocktopick.com/public_html/index.php on line 141
Warning: DOMDocument::loadHTML(): Unexpected end tag : a in Entity, line: 237 in /home/u552734802/domains/dailystocktopick.com/public_html/index.php on line 141
Warning: DOMDocument::loadHTML(): Unexpected end tag : a in Entity, line: 237 in /home/u552734802/domains/dailystocktopick.com/public_html/index.php on line 141
Warning: DOMDocument::loadHTML(): Unexpected end tag : a in Entity, line: 237 in /home/u552734802/domains/dailystocktopick.com/public_html/index.php on line 141
Warning: DOMDocument::loadHTML(): Unexpected end tag : a in Entity, line: 237 in /home/u552734802/domains/dailystocktopick.com/public_html/index.php on line 141
Warning: DOMDocument::loadHTML(): Unexpected end tag : a in Entity, line: 237 in /home/u552734802/domains/dailystocktopick.com/public_html/index.php on line 141
Warning: DOMDocument::loadHTML(): Unexpected end tag : div in Entity, line: 237 in /home/u552734802/domains/dailystocktopick.com/public_html/index.php on line 141
Warning: DOMDocument::loadHTML(): Unexpected end tag : li in Entity, line: 237 in /home/u552734802/domains/dailystocktopick.com/public_html/index.php on line 141
Warning: DOMDocument::loadHTML(): Unexpected end tag : div in Entity, line: 237 in /home/u552734802/domains/dailystocktopick.com/public_html/index.php on line 141
Warning: DOMDocument::loadHTML(): Unexpected end tag : a in Entity, line: 237 in /home/u552734802/domains/dailystocktopick.com/public_html/index.php on line 141
Warning: DOMDocument::loadHTML(): Unexpected end tag : a in Entity, line: 237 in /home/u552734802/domains/dailystocktopick.com/public_html/index.php on line 141
Warning: DOMDocument::loadHTML(): Unexpected end tag : a in Entity, line: 237 in /home/u552734802/domains/dailystocktopick.com/public_html/index.php on line 141
Warning: DOMDocument::loadHTML(): Unexpected end tag : a in Entity, line: 237 in /home/u552734802/domains/dailystocktopick.com/public_html/index.php on line 141
Warning: DOMDocument::loadHTML(): Unexpected end tag : a in Entity, line: 237 in /home/u552734802/domains/dailystocktopick.com/public_html/index.php on line 141
Warning: DOMDocument::loadHTML(): Unexpected end tag : a in Entity, line: 237 in /home/u552734802/domains/dailystocktopick.com/public_html/index.php on line 141
Warning: DOMDocument::loadHTML(): Unexpected end tag : a in Entity, line: 237 in /home/u552734802/domains/dailystocktopick.com/public_html/index.php on line 141
Warning: DOMDocument::loadHTML(): Unexpected end tag : a in Entity, line: 237 in /home/u552734802/domains/dailystocktopick.com/public_html/index.php on line 141
Warning: DOMDocument::loadHTML(): Unexpected end tag : a in Entity, line: 237 in /home/u552734802/domains/dailystocktopick.com/public_html/index.php on line 141
Warning: DOMDocument::loadHTML(): Unexpected end tag : a in Entity, line: 237 in /home/u552734802/domains/dailystocktopick.com/public_html/index.php on line 141
Warning: DOMDocument::loadHTML(): Unexpected end tag : a in Entity, line: 237 in /home/u552734802/domains/dailystocktopick.com/public_html/index.php on line 141
Warning: DOMDocument::loadHTML(): Unexpected end tag : a in Entity, line: 237 in /home/u552734802/domains/dailystocktopick.com/public_html/index.php on line 141
Warning: DOMDocument::loadHTML(): Unexpected end tag : a in Entity, line: 237 in /home/u552734802/domains/dailystocktopick.com/public_html/index.php on line 141
Warning: DOMDocument::loadHTML(): Unexpected end tag : div in Entity, line: 237 in /home/u552734802/domains/dailystocktopick.com/public_html/index.php on line 141
Warning: DOMDocument::loadHTML(): Unexpected end tag : li in Entity, line: 237 in /home/u552734802/domains/dailystocktopick.com/public_html/index.php on line 141
Warning: DOMDocument::loadHTML(): Unexpected end tag : div in Entity, line: 237 in /home/u552734802/domains/dailystocktopick.com/public_html/index.php on line 141
Warning: DOMDocument::loadHTML(): Unexpected end tag : a in Entity, line: 237 in /home/u552734802/domains/dailystocktopick.com/public_html/index.php on line 141
Warning: DOMDocument::loadHTML(): Unexpected end tag : a in Entity, line: 237 in /home/u552734802/domains/dailystocktopick.com/public_html/index.php on line 141
Warning: DOMDocument::loadHTML(): Unexpected end tag : a in Entity, line: 237 in /home/u552734802/domains/dailystocktopick.com/public_html/index.php on line 141
Warning: DOMDocument::loadHTML(): Unexpected end tag : a in Entity, line: 237 in /home/u552734802/domains/dailystocktopick.com/public_html/index.php on line 141
Warning: DOMDocument::loadHTML(): Unexpected end tag : a in Entity, line: 237 in /home/u552734802/domains/dailystocktopick.com/public_html/index.php on line 141
Warning: DOMDocument::loadHTML(): Unexpected end tag : a in Entity, line: 237 in /home/u552734802/domains/dailystocktopick.com/public_html/index.php on line 141
Warning: DOMDocument::loadHTML(): Unexpected end tag : a in Entity, line: 237 in /home/u552734802/domains/dailystocktopick.com/public_html/index.php on line 141
Warning: DOMDocument::loadHTML(): Unexpected end tag : a in Entity, line: 237 in /home/u552734802/domains/dailystocktopick.com/public_html/index.php on line 141
Warning: DOMDocument::loadHTML(): Unexpected end tag : a in Entity, line: 237 in /home/u552734802/domains/dailystocktopick.com/public_html/index.php on line 141
Warning: DOMDocument::loadHTML(): Unexpected end tag : a in Entity, line: 237 in /home/u552734802/domains/dailystocktopick.com/public_html/index.php on line 141
Warning: DOMDocument::loadHTML(): Unexpected end tag : a in Entity, line: 237 in /home/u552734802/domains/dailystocktopick.com/public_html/index.php on line 141
Warning: DOMDocument::loadHTML(): Unexpected end tag : a in Entity, line: 237 in /home/u552734802/domains/dailystocktopick.com/public_html/index.php on line 141
Warning: DOMDocument::loadHTML(): Unexpected end tag : a in Entity, line: 237 in /home/u552734802/domains/dailystocktopick.com/public_html/index.php on line 141
Warning: DOMDocument::loadHTML(): Unexpected end tag : a in Entity, line: 237 in /home/u552734802/domains/dailystocktopick.com/public_html/index.php on line 141
Warning: DOMDocument::loadHTML(): Unexpected end tag : a in Entity, line: 237 in /home/u552734802/domains/dailystocktopick.com/public_html/index.php on line 141
Warning: DOMDocument::loadHTML(): Unexpected end tag : div in Entity, line: 237 in /home/u552734802/domains/dailystocktopick.com/public_html/index.php on line 141
Warning: DOMDocument::loadHTML(): Unexpected end tag : li in Entity, line: 237 in /home/u552734802/domains/dailystocktopick.com/public_html/index.php on line 141
Warning: DOMDocument::loadHTML(): Unexpected end tag : div in Entity, line: 237 in /home/u552734802/domains/dailystocktopick.com/public_html/index.php on line 141
Warning: DOMDocument::loadHTML(): Unexpected end tag : a in Entity, line: 237 in /home/u552734802/domains/dailystocktopick.com/public_html/index.php on line 141
Warning: DOMDocument::loadHTML(): Unexpected end tag : a in Entity, line: 237 in /home/u552734802/domains/dailystocktopick.com/public_html/index.php on line 141
Warning: DOMDocument::loadHTML(): Unexpected end tag : a in Entity, line: 237 in /home/u552734802/domains/dailystocktopick.com/public_html/index.php on line 141
Warning: DOMDocument::loadHTML(): Unexpected end tag : a in Entity, line: 237 in /home/u552734802/domains/dailystocktopick.com/public_html/index.php on line 141
Warning: DOMDocument::loadHTML(): Unexpected end tag : a in Entity, line: 237 in /home/u552734802/domains/dailystocktopick.com/public_html/index.php on line 141
Warning: DOMDocument::loadHTML(): Unexpected end tag : a in Entity, line: 237 in /home/u552734802/domains/dailystocktopick.com/public_html/index.php on line 141
Warning: DOMDocument::loadHTML(): Unexpected end tag : a in Entity, line: 237 in /home/u552734802/domains/dailystocktopick.com/public_html/index.php on line 141
Warning: DOMDocument::loadHTML(): Unexpected end tag : a in Entity, line: 237 in /home/u552734802/domains/dailystocktopick.com/public_html/index.php on line 141
Warning: DOMDocument::loadHTML(): Unexpected end tag : a in Entity, line: 237 in /home/u552734802/domains/dailystocktopick.com/public_html/index.php on line 141
Warning: DOMDocument::loadHTML(): Unexpected end tag : a in Entity, line: 237 in /home/u552734802/domains/dailystocktopick.com/public_html/index.php on line 141
Warning: DOMDocument::loadHTML(): Unexpected end tag : div in Entity, line: 237 in /home/u552734802/domains/dailystocktopick.com/public_html/index.php on line 141
Warning: DOMDocument::loadHTML(): Unexpected end tag : li in Entity, line: 237 in /home/u552734802/domains/dailystocktopick.com/public_html/index.php on line 141
Warning: DOMDocument::loadHTML(): Unexpected end tag : div in Entity, line: 237 in /home/u552734802/domains/dailystocktopick.com/public_html/index.php on line 141
Warning: DOMDocument::loadHTML(): Unexpected end tag : a in Entity, line: 237 in /home/u552734802/domains/dailystocktopick.com/public_html/index.php on line 141
Warning: DOMDocument::loadHTML(): Unexpected end tag : a in Entity, line: 237 in /home/u552734802/domains/dailystocktopick.com/public_html/index.php on line 141
Warning: DOMDocument::loadHTML(): Unexpected end tag : a in Entity, line: 237 in /home/u552734802/domains/dailystocktopick.com/public_html/index.php on line 141
Warning: DOMDocument::loadHTML(): Unexpected end tag : a in Entity, line: 237 in /home/u552734802/domains/dailystocktopick.com/public_html/index.php on line 141
Warning: DOMDocument::loadHTML(): Unexpected end tag : a in Entity, line: 237 in /home/u552734802/domains/dailystocktopick.com/public_html/index.php on line 141
Warning: DOMDocument::loadHTML(): Unexpected end tag : a in Entity, line: 237 in /home/u552734802/domains/dailystocktopick.com/public_html/index.php on line 141
Warning: DOMDocument::loadHTML(): Unexpected end tag : a in Entity, line: 237 in /home/u552734802/domains/dailystocktopick.com/public_html/index.php on line 141
Warning: DOMDocument::loadHTML(): Unexpected end tag : a in Entity, line: 237 in /home/u552734802/domains/dailystocktopick.com/public_html/index.php on line 141
Warning: DOMDocument::loadHTML(): Unexpected end tag : a in Entity, line: 237 in /home/u552734802/domains/dailystocktopick.com/public_html/index.php on line 141
Warning: DOMDocument::loadHTML(): Unexpected end tag : a in Entity, line: 237 in /home/u552734802/domains/dailystocktopick.com/public_html/index.php on line 141
Warning: DOMDocument::loadHTML(): Unexpected end tag : a in Entity, line: 237 in /home/u552734802/domains/dailystocktopick.com/public_html/index.php on line 141
Warning: DOMDocument::loadHTML(): Unexpected end tag : a in Entity, line: 237 in /home/u552734802/domains/dailystocktopick.com/public_html/index.php on line 141
Warning: DOMDocument::loadHTML(): Unexpected end tag : a in Entity, line: 237 in /home/u552734802/domains/dailystocktopick.com/public_html/index.php on line 141
Warning: DOMDocument::loadHTML(): Unexpected end tag : a in Entity, line: 237 in /home/u552734802/domains/dailystocktopick.com/public_html/index.php on line 141
Warning: DOMDocument::loadHTML(): Unexpected end tag : a in Entity, line: 237 in /home/u552734802/domains/dailystocktopick.com/public_html/index.php on line 141
Warning: DOMDocument::loadHTML(): Unexpected end tag : a in Entity, line: 237 in /home/u552734802/domains/dailystocktopick.com/public_html/index.php on line 141
Warning: DOMDocument::loadHTML(): Unexpected end tag : a in Entity, line: 237 in /home/u552734802/domains/dailystocktopick.com/public_html/index.php on line 141
Warning: DOMDocument::loadHTML(): Unexpected end tag : a in Entity, line: 237 in /home/u552734802/domains/dailystocktopick.com/public_html/index.php on line 141
Warning: DOMDocument::loadHTML(): Unexpected end tag : a in Entity, line: 237 in /home/u552734802/domains/dailystocktopick.com/public_html/index.php on line 141
Warning: DOMDocument::loadHTML(): Unexpected end tag : div in Entity, line: 237 in /home/u552734802/domains/dailystocktopick.com/public_html/index.php on line 141
Warning: DOMDocument::loadHTML(): Unexpected end tag : li in Entity, line: 237 in /home/u552734802/domains/dailystocktopick.com/public_html/index.php on line 141
Warning: DOMDocument::loadHTML(): Unexpected end tag : div in Entity, line: 237 in /home/u552734802/domains/dailystocktopick.com/public_html/index.php on line 141
Warning: DOMDocument::loadHTML(): Unexpected end tag : a in Entity, line: 237 in /home/u552734802/domains/dailystocktopick.com/public_html/index.php on line 141
Warning: DOMDocument::loadHTML(): Unexpected end tag : a in Entity, line: 237 in /home/u552734802/domains/dailystocktopick.com/public_html/index.php on line 141
Warning: DOMDocument::loadHTML(): Unexpected end tag : a in Entity, line: 237 in /home/u552734802/domains/dailystocktopick.com/public_html/index.php on line 141
Warning: DOMDocument::loadHTML(): Unexpected end tag : a in Entity, line: 237 in /home/u552734802/domains/dailystocktopick.com/public_html/index.php on line 141
Warning: DOMDocument::loadHTML(): Unexpected end tag : a in Entity, line: 237 in /home/u552734802/domains/dailystocktopick.com/public_html/index.php on line 141
Warning: DOMDocument::loadHTML(): Unexpected end tag : a in Entity, line: 237 in /home/u552734802/domains/dailystocktopick.com/public_html/index.php on line 141
Warning: DOMDocument::loadHTML(): Unexpected end tag : a in Entity, line: 237 in /home/u552734802/domains/dailystocktopick.com/public_html/index.php on line 141
Warning: DOMDocument::loadHTML(): Unexpected end tag : a in Entity, line: 237 in /home/u552734802/domains/dailystocktopick.com/public_html/index.php on line 141
Warning: DOMDocument::loadHTML(): Unexpected end tag : a in Entity, line: 237 in /home/u552734802/domains/dailystocktopick.com/public_html/index.php on line 141
Warning: DOMDocument::loadHTML(): Unexpected end tag : a in Entity, line: 237 in /home/u552734802/domains/dailystocktopick.com/public_html/index.php on line 141
Warning: DOMDocument::loadHTML(): Unexpected end tag : a in Entity, line: 237 in /home/u552734802/domains/dailystocktopick.com/public_html/index.php on line 141
Warning: DOMDocument::loadHTML(): Unexpected end tag : a in Entity, line: 237 in /home/u552734802/domains/dailystocktopick.com/public_html/index.php on line 141
Warning: DOMDocument::loadHTML(): Unexpected end tag : a in Entity, line: 237 in /home/u552734802/domains/dailystocktopick.com/public_html/index.php on line 141
Warning: DOMDocument::loadHTML(): Unexpected end tag : div in Entity, line: 237 in /home/u552734802/domains/dailystocktopick.com/public_html/index.php on line 141
Warning: DOMDocument::loadHTML(): Unexpected end tag : li in Entity, line: 237 in /home/u552734802/domains/dailystocktopick.com/public_html/index.php on line 141
Warning: DOMDocument::loadHTML(): Unexpected end tag : div in Entity, line: 237 in /home/u552734802/domains/dailystocktopick.com/public_html/index.php on line 141
Warning: DOMDocument::loadHTML(): Unexpected end tag : a in Entity, line: 237 in /home/u552734802/domains/dailystocktopick.com/public_html/index.php on line 141
Warning: DOMDocument::loadHTML(): Unexpected end tag : a in Entity, line: 237 in /home/u552734802/domains/dailystocktopick.com/public_html/index.php on line 141
Warning: DOMDocument::loadHTML(): Unexpected end tag : a in Entity, line: 237 in /home/u552734802/domains/dailystocktopick.com/public_html/index.php on line 141
Warning: DOMDocument::loadHTML(): Unexpected end tag : a in Entity, line: 237 in /home/u552734802/domains/dailystocktopick.com/public_html/index.php on line 141
Warning: DOMDocument::loadHTML(): Unexpected end tag : a in Entity, line: 237 in /home/u552734802/domains/dailystocktopick.com/public_html/index.php on line 141
Warning: DOMDocument::loadHTML(): Unexpected end tag : a in Entity, line: 237 in /home/u552734802/domains/dailystocktopick.com/public_html/index.php on line 141
Warning: DOMDocument::loadHTML(): Unexpected end tag : a in Entity, line: 237 in /home/u552734802/domains/dailystocktopick.com/public_html/index.php on line 141
Warning: DOMDocument::loadHTML(): Unexpected end tag : a in Entity, line: 237 in /home/u552734802/domains/dailystocktopick.com/public_html/index.php on line 141
Warning: DOMDocument::loadHTML(): Unexpected end tag : div in Entity, line: 237 in /home/u552734802/domains/dailystocktopick.com/public_html/index.php on line 141
Warning: DOMDocument::loadHTML(): Unexpected end tag : li in Entity, line: 237 in /home/u552734802/domains/dailystocktopick.com/public_html/index.php on line 141
Warning: DOMDocument::loadHTML(): Unexpected end tag : div in Entity, line: 237 in /home/u552734802/domains/dailystocktopick.com/public_html/index.php on line 141
Warning: DOMDocument::loadHTML(): Unexpected end tag : a in Entity, line: 237 in /home/u552734802/domains/dailystocktopick.com/public_html/index.php on line 141
Warning: DOMDocument::loadHTML(): Unexpected end tag : a in Entity, line: 237 in /home/u552734802/domains/dailystocktopick.com/public_html/index.php on line 141
Warning: DOMDocument::loadHTML(): Unexpected end tag : a in Entity, line: 237 in /home/u552734802/domains/dailystocktopick.com/public_html/index.php on line 141
Warning: DOMDocument::loadHTML(): Unexpected end tag : a in Entity, line: 237 in /home/u552734802/domains/dailystocktopick.com/public_html/index.php on line 141
Warning: DOMDocument::loadHTML(): Unexpected end tag : a in Entity, line: 237 in /home/u552734802/domains/dailystocktopick.com/public_html/index.php on line 141
Warning: DOMDocument::loadHTML(): Unexpected end tag : a in Entity, line: 237 in /home/u552734802/domains/dailystocktopick.com/public_html/index.php on line 141
Warning: DOMDocument::loadHTML(): Unexpected end tag : a in Entity, line: 237 in /home/u552734802/domains/dailystocktopick.com/public_html/index.php on line 141
Warning: DOMDocument::loadHTML(): Unexpected end tag : a in Entity, line: 237 in /home/u552734802/domains/dailystocktopick.com/public_html/index.php on line 141
Warning: DOMDocument::loadHTML(): Unexpected end tag : a in Entity, line: 237 in /home/u552734802/domains/dailystocktopick.com/public_html/index.php on line 141
Warning: DOMDocument::loadHTML(): Unexpected end tag : a in Entity, line: 237 in /home/u552734802/domains/dailystocktopick.com/public_html/index.php on line 141
Warning: DOMDocument::loadHTML(): Unexpected end tag : a in Entity, line: 237 in /home/u552734802/domains/dailystocktopick.com/public_html/index.php on line 141
Warning: DOMDocument::loadHTML(): Unexpected end tag : a in Entity, line: 237 in /home/u552734802/domains/dailystocktopick.com/public_html/index.php on line 141
Warning: DOMDocument::loadHTML(): Unexpected end tag : a in Entity, line: 237 in /home/u552734802/domains/dailystocktopick.com/public_html/index.php on line 141
Warning: DOMDocument::loadHTML(): Unexpected end tag : a in Entity, line: 237 in /home/u552734802/domains/dailystocktopick.com/public_html/index.php on line 141
Warning: DOMDocument::loadHTML(): Unexpected end tag : a in Entity, line: 237 in /home/u552734802/domains/dailystocktopick.com/public_html/index.php on line 141
Warning: DOMDocument::loadHTML(): Unexpected end tag : a in Entity, line: 237 in /home/u552734802/domains/dailystocktopick.com/public_html/index.php on line 141
Warning: DOMDocument::loadHTML(): Unexpected end tag : div in Entity, line: 237 in /home/u552734802/domains/dailystocktopick.com/public_html/index.php on line 141
Warning: DOMDocument::loadHTML(): Unexpected end tag : li in Entity, line: 237 in /home/u552734802/domains/dailystocktopick.com/public_html/index.php on line 141
Warning: DOMDocument::loadHTML(): Unexpected end tag : div in Entity, line: 237 in /home/u552734802/domains/dailystocktopick.com/public_html/index.php on line 141
Warning: DOMDocument::loadHTML(): Unexpected end tag : a in Entity, line: 237 in /home/u552734802/domains/dailystocktopick.com/public_html/index.php on line 141
Warning: DOMDocument::loadHTML(): Unexpected end tag : a in Entity, line: 237 in /home/u552734802/domains/dailystocktopick.com/public_html/index.php on line 141
Warning: DOMDocument::loadHTML(): Unexpected end tag : a in Entity, line: 237 in /home/u552734802/domains/dailystocktopick.com/public_html/index.php on line 141
Warning: DOMDocument::loadHTML(): Unexpected end tag : a in Entity, line: 237 in /home/u552734802/domains/dailystocktopick.com/public_html/index.php on line 141
Warning: DOMDocument::loadHTML(): Unexpected end tag : a in Entity, line: 237 in /home/u552734802/domains/dailystocktopick.com/public_html/index.php on line 141
Warning: DOMDocument::loadHTML(): Unexpected end tag : a in Entity, line: 237 in /home/u552734802/domains/dailystocktopick.com/public_html/index.php on line 141
Warning: DOMDocument::loadHTML(): Unexpected end tag : a in Entity, line: 237 in /home/u552734802/domains/dailystocktopick.com/public_html/index.php on line 141
Warning: DOMDocument::loadHTML(): Unexpected end tag : a in Entity, line: 237 in /home/u552734802/domains/dailystocktopick.com/public_html/index.php on line 141
Warning: DOMDocument::loadHTML(): Unexpected end tag : a in Entity, line: 237 in /home/u552734802/domains/dailystocktopick.com/public_html/index.php on line 141
Warning: DOMDocument::loadHTML(): Unexpected end tag : a in Entity, line: 237 in /home/u552734802/domains/dailystocktopick.com/public_html/index.php on line 141
Warning: DOMDocument::loadHTML(): Unexpected end tag : a in Entity, line: 237 in /home/u552734802/domains/dailystocktopick.com/public_html/index.php on line 141
Warning: DOMDocument::loadHTML(): Unexpected end tag : a in Entity, line: 237 in /home/u552734802/domains/dailystocktopick.com/public_html/index.php on line 141
Warning: DOMDocument::loadHTML(): Unexpected end tag : a in Entity, line: 237 in /home/u552734802/domains/dailystocktopick.com/public_html/index.php on line 141
Warning: DOMDocument::loadHTML(): Unexpected end tag : a in Entity, line: 237 in /home/u552734802/domains/dailystocktopick.com/public_html/index.php on line 141
Warning: DOMDocument::loadHTML(): Unexpected end tag : a in Entity, line: 237 in /home/u552734802/domains/dailystocktopick.com/public_html/index.php on line 141
Warning: DOMDocument::loadHTML(): Unexpected end tag : div in Entity, line: 237 in /home/u552734802/domains/dailystocktopick.com/public_html/index.php on line 141
Warning: DOMDocument::loadHTML(): Unexpected end tag : li in Entity, line: 237 in /home/u552734802/domains/dailystocktopick.com/public_html/index.php on line 141
Warning: DOMDocument::loadHTML(): Unexpected end tag : div in Entity, line: 237 in /home/u552734802/domains/dailystocktopick.com/public_html/index.php on line 141
Warning: DOMDocument::loadHTML(): Unexpected end tag : a in Entity, line: 237 in /home/u552734802/domains/dailystocktopick.com/public_html/index.php on line 141
Warning: DOMDocument::loadHTML(): Unexpected end tag : a in Entity, line: 237 in /home/u552734802/domains/dailystocktopick.com/public_html/index.php on line 141
Warning: DOMDocument::loadHTML(): Unexpected end tag : a in Entity, line: 237 in /home/u552734802/domains/dailystocktopick.com/public_html/index.php on line 141
Warning: DOMDocument::loadHTML(): Unexpected end tag : a in Entity, line: 237 in /home/u552734802/domains/dailystocktopick.com/public_html/index.php on line 141
Warning: DOMDocument::loadHTML(): Unexpected end tag : a in Entity, line: 237 in /home/u552734802/domains/dailystocktopick.com/public_html/index.php on line 141
Warning: DOMDocument::loadHTML(): Unexpected end tag : a in Entity, line: 237 in /home/u552734802/domains/dailystocktopick.com/public_html/index.php on line 141
Warning: DOMDocument::loadHTML(): Unexpected end tag : a in Entity, line: 237 in /home/u552734802/domains/dailystocktopick.com/public_html/index.php on line 141
Warning: DOMDocument::loadHTML(): Unexpected end tag : a in Entity, line: 237 in /home/u552734802/domains/dailystocktopick.com/public_html/index.php on line 141
Warning: DOMDocument::loadHTML(): Unexpected end tag : a in Entity, line: 237 in /home/u552734802/domains/dailystocktopick.com/public_html/index.php on line 141
Warning: DOMDocument::loadHTML(): Unexpected end tag : a in Entity, line: 237 in /home/u552734802/domains/dailystocktopick.com/public_html/index.php on line 141
Warning: DOMDocument::loadHTML(): Unexpected end tag : a in Entity, line: 237 in /home/u552734802/domains/dailystocktopick.com/public_html/index.php on line 141
Warning: DOMDocument::loadHTML(): Unexpected end tag : a in Entity, line: 237 in /home/u552734802/domains/dailystocktopick.com/public_html/index.php on line 141
Warning: DOMDocument::loadHTML(): Unexpected end tag : a in Entity, line: 237 in /home/u552734802/domains/dailystocktopick.com/public_html/index.php on line 141
Warning: DOMDocument::loadHTML(): Unexpected end tag : a in Entity, line: 237 in /home/u552734802/domains/dailystocktopick.com/public_html/index.php on line 141
Warning: DOMDocument::loadHTML(): Unexpected end tag : a in Entity, line: 237 in /home/u552734802/domains/dailystocktopick.com/public_html/index.php on line 141
Warning: DOMDocument::loadHTML(): Unexpected end tag : a in Entity, line: 237 in /home/u552734802/domains/dailystocktopick.com/public_html/index.php on line 141
Warning: DOMDocument::loadHTML(): Unexpected end tag : a in Entity, line: 237 in /home/u552734802/domains/dailystocktopick.com/public_html/index.php on line 141
Warning: DOMDocument::loadHTML(): Unexpected end tag : div in Entity, line: 237 in /home/u552734802/domains/dailystocktopick.com/public_html/index.php on line 141
Warning: DOMDocument::loadHTML(): Unexpected end tag : li in Entity, line: 237 in /home/u552734802/domains/dailystocktopick.com/public_html/index.php on line 141
Warning: DOMDocument::loadHTML(): Unexpected end tag : div in Entity, line: 237 in /home/u552734802/domains/dailystocktopick.com/public_html/index.php on line 141
Warning: DOMDocument::loadHTML(): Unexpected end tag : a in Entity, line: 237 in /home/u552734802/domains/dailystocktopick.com/public_html/index.php on line 141
Warning: DOMDocument::loadHTML(): Unexpected end tag : a in Entity, line: 237 in /home/u552734802/domains/dailystocktopick.com/public_html/index.php on line 141
Warning: DOMDocument::loadHTML(): Unexpected end tag : a in Entity, line: 237 in /home/u552734802/domains/dailystocktopick.com/public_html/index.php on line 141
Warning: DOMDocument::loadHTML(): Unexpected end tag : a in Entity, line: 237 in /home/u552734802/domains/dailystocktopick.com/public_html/index.php on line 141
Warning: DOMDocument::loadHTML(): Unexpected end tag : a in Entity, line: 237 in /home/u552734802/domains/dailystocktopick.com/public_html/index.php on line 141
Warning: DOMDocument::loadHTML(): Unexpected end tag : a in Entity, line: 237 in /home/u552734802/domains/dailystocktopick.com/public_html/index.php on line 141
Warning: DOMDocument::loadHTML(): Unexpected end tag : a in Entity, line: 237 in /home/u552734802/domains/dailystocktopick.com/public_html/index.php on line 141
Warning: DOMDocument::loadHTML(): Unexpected end tag : a in Entity, line: 237 in /home/u552734802/domains/dailystocktopick.com/public_html/index.php on line 141
Warning: DOMDocument::loadHTML(): Unexpected end tag : a in Entity, line: 237 in /home/u552734802/domains/dailystocktopick.com/public_html/index.php on line 141
Warning: DOMDocument::loadHTML(): Unexpected end tag : a in Entity, line: 237 in /home/u552734802/domains/dailystocktopick.com/public_html/index.php on line 141
Warning: DOMDocument::loadHTML(): Unexpected end tag : a in Entity, line: 237 in /home/u552734802/domains/dailystocktopick.com/public_html/index.php on line 141
Warning: DOMDocument::loadHTML(): Unexpected end tag : a in Entity, line: 237 in /home/u552734802/domains/dailystocktopick.com/public_html/index.php on line 141
Warning: DOMDocument::loadHTML(): Unexpected end tag : a in Entity, line: 237 in /home/u552734802/domains/dailystocktopick.com/public_html/index.php on line 141
Warning: DOMDocument::loadHTML(): Unexpected end tag : div in Entity, line: 237 in /home/u552734802/domains/dailystocktopick.com/public_html/index.php on line 141
Warning: DOMDocument::loadHTML(): Unexpected end tag : li in Entity, line: 237 in /home/u552734802/domains/dailystocktopick.com/public_html/index.php on line 141
Warning: DOMDocument::loadHTML(): Unexpected end tag : ul in Entity, line: 237 in /home/u552734802/domains/dailystocktopick.com/public_html/index.php on line 141
Warning: DOMDocument::loadHTML(): Unexpected end tag : h2 in Entity, line: 252 in /home/u552734802/domains/dailystocktopick.com/public_html/index.php on line 141
Warning: DOMDocument::loadHTML(): Unexpected end tag : p in Entity, line: 253 in /home/u552734802/domains/dailystocktopick.com/public_html/index.php on line 141
Warning: DOMDocument::loadHTML(): Unexpected end tag : button in Entity, line: 256 in /home/u552734802/domains/dailystocktopick.com/public_html/index.php on line 141
Warning: DOMDocument::loadHTML(): Unexpected end tag : div in Entity, line: 257 in /home/u552734802/domains/dailystocktopick.com/public_html/index.php on line 141
Warning: DOMDocument::loadHTML(): Unexpected end tag : i in Entity, line: 237 in /home/u552734802/domains/dailystocktopick.com/public_html/index.php on line 141
Warning: DOMDocument::loadHTML(): Unexpected end tag : span in Entity, line: 237 in /home/u552734802/domains/dailystocktopick.com/public_html/index.php on line 141
Warning: DOMDocument::loadHTML(): Unexpected end tag : div in Entity, line: 237 in /home/u552734802/domains/dailystocktopick.com/public_html/index.php on line 141
Warning: DOMDocument::loadHTML(): Unexpected end tag : div in Entity, line: 237 in /home/u552734802/domains/dailystocktopick.com/public_html/index.php on line 141
Warning: DOMDocument::loadHTML(): Unexpected end tag : a in Entity, line: 237 in /home/u552734802/domains/dailystocktopick.com/public_html/index.php on line 141
Warning: DOMDocument::loadHTML(): Unexpected end tag : a in Entity, line: 237 in /home/u552734802/domains/dailystocktopick.com/public_html/index.php on line 141
Warning: DOMDocument::loadHTML(): Unexpected end tag : a in Entity, line: 237 in /home/u552734802/domains/dailystocktopick.com/public_html/index.php on line 141
Warning: DOMDocument::loadHTML(): Unexpected end tag : a in Entity, line: 237 in /home/u552734802/domains/dailystocktopick.com/public_html/index.php on line 141
Warning: DOMDocument::loadHTML(): Unexpected end tag : a in Entity, line: 237 in /home/u552734802/domains/dailystocktopick.com/public_html/index.php on line 141
Warning: DOMDocument::loadHTML(): Unexpected end tag : a in Entity, line: 237 in /home/u552734802/domains/dailystocktopick.com/public_html/index.php on line 141
Warning: DOMDocument::loadHTML(): Unexpected end tag : a in Entity, line: 237 in /home/u552734802/domains/dailystocktopick.com/public_html/index.php on line 141
Warning: DOMDocument::loadHTML(): Unexpected end tag : a in Entity, line: 237 in /home/u552734802/domains/dailystocktopick.com/public_html/index.php on line 141
Warning: DOMDocument::loadHTML(): Unexpected end tag : a in Entity, line: 237 in /home/u552734802/domains/dailystocktopick.com/public_html/index.php on line 141
Warning: DOMDocument::loadHTML(): Unexpected end tag : a in Entity, line: 237 in /home/u552734802/domains/dailystocktopick.com/public_html/index.php on line 141
Warning: DOMDocument::loadHTML(): Unexpected end tag : a in Entity, line: 237 in /home/u552734802/domains/dailystocktopick.com/public_html/index.php on line 141
Warning: DOMDocument::loadHTML(): Unexpected end tag : div in Entity, line: 237 in /home/u552734802/domains/dailystocktopick.com/public_html/index.php on line 141
Warning: DOMDocument::loadHTML(): Unexpected end tag : li in Entity, line: 237 in /home/u552734802/domains/dailystocktopick.com/public_html/index.php on line 141
Warning: DOMDocument::loadHTML(): Unexpected end tag : div in Entity, line: 237 in /home/u552734802/domains/dailystocktopick.com/public_html/index.php on line 141
Warning: DOMDocument::loadHTML(): Unexpected end tag : a in Entity, line: 237 in /home/u552734802/domains/dailystocktopick.com/public_html/index.php on line 141
Warning: DOMDocument::loadHTML(): Unexpected end tag : a in Entity, line: 237 in /home/u552734802/domains/dailystocktopick.com/public_html/index.php on line 141
Warning: DOMDocument::loadHTML(): Unexpected end tag : a in Entity, line: 237 in /home/u552734802/domains/dailystocktopick.com/public_html/index.php on line 141
Warning: DOMDocument::loadHTML(): Unexpected end tag : a in Entity, line: 237 in /home/u552734802/domains/dailystocktopick.com/public_html/index.php on line 141
Warning: DOMDocument::loadHTML(): Unexpected end tag : a in Entity, line: 237 in /home/u552734802/domains/dailystocktopick.com/public_html/index.php on line 141
Warning: DOMDocument::loadHTML(): Unexpected end tag : a in Entity, line: 237 in /home/u552734802/domains/dailystocktopick.com/public_html/index.php on line 141
Warning: DOMDocument::loadHTML(): Unexpected end tag : a in Entity, line: 237 in /home/u552734802/domains/dailystocktopick.com/public_html/index.php on line 141
Warning: DOMDocument::loadHTML(): Unexpected end tag : a in Entity, line: 237 in /home/u552734802/domains/dailystocktopick.com/public_html/index.php on line 141
Warning: DOMDocument::loadHTML(): Unexpected end tag : a in Entity, line: 237 in /home/u552734802/domains/dailystocktopick.com/public_html/index.php on line 141
Warning: DOMDocument::loadHTML(): Unexpected end tag : a in Entity, line: 237 in /home/u552734802/domains/dailystocktopick.com/public_html/index.php on line 141
Warning: DOMDocument::loadHTML(): Unexpected end tag : a in Entity, line: 237 in /home/u552734802/domains/dailystocktopick.com/public_html/index.php on line 141
Warning: DOMDocument::loadHTML(): Unexpected end tag : a in Entity, line: 237 in /home/u552734802/domains/dailystocktopick.com/public_html/index.php on line 141
Warning: DOMDocument::loadHTML(): Unexpected end tag : div in Entity, line: 237 in /home/u552734802/domains/dailystocktopick.com/public_html/index.php on line 141
Warning: DOMDocument::loadHTML(): Unexpected end tag : li in Entity, line: 237 in /home/u552734802/domains/dailystocktopick.com/public_html/index.php on line 141
Warning: DOMDocument::loadHTML(): Unexpected end tag : div in Entity, line: 237 in /home/u552734802/domains/dailystocktopick.com/public_html/index.php on line 141
Warning: DOMDocument::loadHTML(): Unexpected end tag : a in Entity, line: 237 in /home/u552734802/domains/dailystocktopick.com/public_html/index.php on line 141
Warning: DOMDocument::loadHTML(): Unexpected end tag : a in Entity, line: 237 in /home/u552734802/domains/dailystocktopick.com/public_html/index.php on line 141
Warning: DOMDocument::loadHTML(): Unexpected end tag : a in Entity, line: 237 in /home/u552734802/domains/dailystocktopick.com/public_html/index.php on line 141
Warning: DOMDocument::loadHTML(): Unexpected end tag : a in Entity, line: 237 in /home/u552734802/domains/dailystocktopick.com/public_html/index.php on line 141
Warning: DOMDocument::loadHTML(): Unexpected end tag : a in Entity, line: 237 in /home/u552734802/domains/dailystocktopick.com/public_html/index.php on line 141
Warning: DOMDocument::loadHTML(): Unexpected end tag : a in Entity, line: 237 in /home/u552734802/domains/dailystocktopick.com/public_html/index.php on line 141
Warning: DOMDocument::loadHTML(): Unexpected end tag : a in Entity, line: 237 in /home/u552734802/domains/dailystocktopick.com/public_html/index.php on line 141
Warning: DOMDocument::loadHTML(): Unexpected end tag : a in Entity, line: 237 in /home/u552734802/domains/dailystocktopick.com/public_html/index.php on line 141
Warning: DOMDocument::loadHTML(): Unexpected end tag : div in Entity, line: 237 in /home/u552734802/domains/dailystocktopick.com/public_html/index.php on line 141
Warning: DOMDocument::loadHTML(): Unexpected end tag : li in Entity, line: 237 in /home/u552734802/domains/dailystocktopick.com/public_html/index.php on line 141
Warning: DOMDocument::loadHTML(): Unexpected end tag : div in Entity, line: 237 in /home/u552734802/domains/dailystocktopick.com/public_html/index.php on line 141
Warning: DOMDocument::loadHTML(): Unexpected end tag : a in Entity, line: 237 in /home/u552734802/domains/dailystocktopick.com/public_html/index.php on line 141
Warning: DOMDocument::loadHTML(): Unexpected end tag : a in Entity, line: 237 in /home/u552734802/domains/dailystocktopick.com/public_html/index.php on line 141
Warning: DOMDocument::loadHTML(): Unexpected end tag : a in Entity, line: 237 in /home/u552734802/domains/dailystocktopick.com/public_html/index.php on line 141
Warning: DOMDocument::loadHTML(): Unexpected end tag : a in Entity, line: 237 in /home/u552734802/domains/dailystocktopick.com/public_html/index.php on line 141
Warning: DOMDocument::loadHTML(): Unexpected end tag : a in Entity, line: 237 in /home/u552734802/domains/dailystocktopick.com/public_html/index.php on line 141
Warning: DOMDocument::loadHTML(): Unexpected end tag : a in Entity, line: 237 in /home/u552734802/domains/dailystocktopick.com/public_html/index.php on line 141
Warning: DOMDocument::loadHTML(): Unexpected end tag : a in Entity, line: 237 in /home/u552734802/domains/dailystocktopick.com/public_html/index.php on line 141
Warning: DOMDocument::loadHTML(): Unexpected end tag : a in Entity, line: 237 in /home/u552734802/domains/dailystocktopick.com/public_html/index.php on line 141
Warning: DOMDocument::loadHTML(): Unexpected end tag : a in Entity, line: 237 in /home/u552734802/domains/dailystocktopick.com/public_html/index.php on line 141
Warning: DOMDocument::loadHTML(): Unexpected end tag : a in Entity, line: 237 in /home/u552734802/domains/dailystocktopick.com/public_html/index.php on line 141
Warning: DOMDocument::loadHTML(): Unexpected end tag : a in Entity, line: 237 in /home/u552734802/domains/dailystocktopick.com/public_html/index.php on line 141
Warning: DOMDocument::loadHTML(): Unexpected end tag : a in Entity, line: 237 in /home/u552734802/domains/dailystocktopick.com/public_html/index.php on line 141
Warning: DOMDocument::loadHTML(): Unexpected end tag : div in Entity, line: 237 in /home/u552734802/domains/dailystocktopick.com/public_html/index.php on line 141
Warning: DOMDocument::loadHTML(): Unexpected end tag : li in Entity, line: 237 in /home/u552734802/domains/dailystocktopick.com/public_html/index.php on line 141
Warning: DOMDocument::loadHTML(): Unexpected end tag : div in Entity, line: 237 in /home/u552734802/domains/dailystocktopick.com/public_html/index.php on line 141
Warning: DOMDocument::loadHTML(): Unexpected end tag : a in Entity, line: 237 in /home/u552734802/domains/dailystocktopick.com/public_html/index.php on line 141
Warning: DOMDocument::loadHTML(): Unexpected end tag : a in Entity, line: 237 in /home/u552734802/domains/dailystocktopick.com/public_html/index.php on line 141
Warning: DOMDocument::loadHTML(): Unexpected end tag : a in Entity, line: 237 in /home/u552734802/domains/dailystocktopick.com/public_html/index.php on line 141
Warning: DOMDocument::loadHTML(): Unexpected end tag : a in Entity, line: 237 in /home/u552734802/domains/dailystocktopick.com/public_html/index.php on line 141
Warning: DOMDocument::loadHTML(): Unexpected end tag : a in Entity, line: 237 in /home/u552734802/domains/dailystocktopick.com/public_html/index.php on line 141
Warning: DOMDocument::loadHTML(): Unexpected end tag : a in Entity, line: 237 in /home/u552734802/domains/dailystocktopick.com/public_html/index.php on line 141
Warning: DOMDocument::loadHTML(): Unexpected end tag : div in Entity, line: 237 in /home/u552734802/domains/dailystocktopick.com/public_html/index.php on line 141
Warning: DOMDocument::loadHTML(): Unexpected end tag : li in Entity, line: 237 in /home/u552734802/domains/dailystocktopick.com/public_html/index.php on line 141
Warning: DOMDocument::loadHTML(): Unexpected end tag : div in Entity, line: 237 in /home/u552734802/domains/dailystocktopick.com/public_html/index.php on line 141
Warning: DOMDocument::loadHTML(): Unexpected end tag : a in Entity, line: 237 in /home/u552734802/domains/dailystocktopick.com/public_html/index.php on line 141
Warning: DOMDocument::loadHTML(): Unexpected end tag : a in Entity, line: 237 in /home/u552734802/domains/dailystocktopick.com/public_html/index.php on line 141
Warning: DOMDocument::loadHTML(): Unexpected end tag : a in Entity, line: 237 in /home/u552734802/domains/dailystocktopick.com/public_html/index.php on line 141
Warning: DOMDocument::loadHTML(): Unexpected end tag : a in Entity, line: 237 in /home/u552734802/domains/dailystocktopick.com/public_html/index.php on line 141
Warning: DOMDocument::loadHTML(): Unexpected end tag : a in Entity, line: 237 in /home/u552734802/domains/dailystocktopick.com/public_html/index.php on line 141
Warning: DOMDocument::loadHTML(): Unexpected end tag : a in Entity, line: 237 in /home/u552734802/domains/dailystocktopick.com/public_html/index.php on line 141
Warning: DOMDocument::loadHTML(): Unexpected end tag : a in Entity, line: 237 in /home/u552734802/domains/dailystocktopick.com/public_html/index.php on line 141
Warning: DOMDocument::loadHTML(): Unexpected end tag : a in Entity, line: 237 in /home/u552734802/domains/dailystocktopick.com/public_html/index.php on line 141
Warning: DOMDocument::loadHTML(): Unexpected end tag : a in Entity, line: 237 in /home/u552734802/domains/dailystocktopick.com/public_html/index.php on line 141
Warning: DOMDocument::loadHTML(): Unexpected end tag : a in Entity, line: 237 in /home/u552734802/domains/dailystocktopick.com/public_html/index.php on line 141
Warning: DOMDocument::loadHTML(): Unexpected end tag : a in Entity, line: 237 in /home/u552734802/domains/dailystocktopick.com/public_html/index.php on line 141
Warning: DOMDocument::loadHTML(): Unexpected end tag : a in Entity, line: 237 in /home/u552734802/domains/dailystocktopick.com/public_html/index.php on line 141
Warning: DOMDocument::loadHTML(): Unexpected end tag : a in Entity, line: 237 in /home/u552734802/domains/dailystocktopick.com/public_html/index.php on line 141
Warning: DOMDocument::loadHTML(): Unexpected end tag : a in Entity, line: 237 in /home/u552734802/domains/dailystocktopick.com/public_html/index.php on line 141
Warning: DOMDocument::loadHTML(): Unexpected end tag : a in Entity, line: 237 in /home/u552734802/domains/dailystocktopick.com/public_html/index.php on line 141
Warning: DOMDocument::loadHTML(): Unexpected end tag : a in Entity, line: 237 in /home/u552734802/domains/dailystocktopick.com/public_html/index.php on line 141
Warning: DOMDocument::loadHTML(): Unexpected end tag : a in Entity, line: 237 in /home/u552734802/domains/dailystocktopick.com/public_html/index.php on line 141
Warning: DOMDocument::loadHTML(): Unexpected end tag : a in Entity, line: 237 in /home/u552734802/domains/dailystocktopick.com/public_html/index.php on line 141
Warning: DOMDocument::loadHTML(): Unexpected end tag : div in Entity, line: 237 in /home/u552734802/domains/dailystocktopick.com/public_html/index.php on line 141
Warning: DOMDocument::loadHTML(): Unexpected end tag : li in Entity, line: 237 in /home/u552734802/domains/dailystocktopick.com/public_html/index.php on line 141
Warning: DOMDocument::loadHTML(): Unexpected end tag : div in Entity, line: 237 in /home/u552734802/domains/dailystocktopick.com/public_html/index.php on line 141
Warning: DOMDocument::loadHTML(): Unexpected end tag : a in Entity, line: 237 in /home/u552734802/domains/dailystocktopick.com/public_html/index.php on line 141
Warning: DOMDocument::loadHTML(): Unexpected end tag : a in Entity, line: 237 in /home/u552734802/domains/dailystocktopick.com/public_html/index.php on line 141
Warning: DOMDocument::loadHTML(): Unexpected end tag : a in Entity, line: 237 in /home/u552734802/domains/dailystocktopick.com/public_html/index.php on line 141
Warning: DOMDocument::loadHTML(): Unexpected end tag : a in Entity, line: 237 in /home/u552734802/domains/dailystocktopick.com/public_html/index.php on line 141
Warning: DOMDocument::loadHTML(): Unexpected end tag : a in Entity, line: 237 in /home/u552734802/domains/dailystocktopick.com/public_html/index.php on line 141
Warning: DOMDocument::loadHTML(): Unexpected end tag : a in Entity, line: 237 in /home/u552734802/domains/dailystocktopick.com/public_html/index.php on line 141
Warning: DOMDocument::loadHTML(): Unexpected end tag : a in Entity, line: 237 in /home/u552734802/domains/dailystocktopick.com/public_html/index.php on line 141
Warning: DOMDocument::loadHTML(): Unexpected end tag : a in Entity, line: 237 in /home/u552734802/domains/dailystocktopick.com/public_html/index.php on line 141
Warning: DOMDocument::loadHTML(): Unexpected end tag : a in Entity, line: 237 in /home/u552734802/domains/dailystocktopick.com/public_html/index.php on line 141
Warning: DOMDocument::loadHTML(): Unexpected end tag : a in Entity, line: 237 in /home/u552734802/domains/dailystocktopick.com/public_html/index.php on line 141
Warning: DOMDocument::loadHTML(): Unexpected end tag : a in Entity, line: 237 in /home/u552734802/domains/dailystocktopick.com/public_html/index.php on line 141
Warning: DOMDocument::loadHTML(): Unexpected end tag : a in Entity, line: 237 in /home/u552734802/domains/dailystocktopick.com/public_html/index.php on line 141
Warning: DOMDocument::loadHTML(): Unexpected end tag : a in Entity, line: 237 in /home/u552734802/domains/dailystocktopick.com/public_html/index.php on line 141
Warning: DOMDocument::loadHTML(): Unexpected end tag : a in Entity, line: 237 in /home/u552734802/domains/dailystocktopick.com/public_html/index.php on line 141
Warning: DOMDocument::loadHTML(): Unexpected end tag : a in Entity, line: 237 in /home/u552734802/domains/dailystocktopick.com/public_html/index.php on line 141
Warning: DOMDocument::loadHTML(): Unexpected end tag : div in Entity, line: 237 in /home/u552734802/domains/dailystocktopick.com/public_html/index.php on line 141
Warning: DOMDocument::loadHTML(): Unexpected end tag : li in Entity, line: 237 in /home/u552734802/domains/dailystocktopick.com/public_html/index.php on line 141
Warning: DOMDocument::loadHTML(): Unexpected end tag : div in Entity, line: 237 in /home/u552734802/domains/dailystocktopick.com/public_html/index.php on line 141
Warning: DOMDocument::loadHTML(): Unexpected end tag : a in Entity, line: 237 in /home/u552734802/domains/dailystocktopick.com/public_html/index.php on line 141
Warning: DOMDocument::loadHTML(): Unexpected end tag : a in Entity, line: 237 in /home/u552734802/domains/dailystocktopick.com/public_html/index.php on line 141
Warning: DOMDocument::loadHTML(): Unexpected end tag : a in Entity, line: 237 in /home/u552734802/domains/dailystocktopick.com/public_html/index.php on line 141
Warning: DOMDocument::loadHTML(): Unexpected end tag : a in Entity, line: 237 in /home/u552734802/domains/dailystocktopick.com/public_html/index.php on line 141
Warning: DOMDocument::loadHTML(): Unexpected end tag : a in Entity, line: 237 in /home/u552734802/domains/dailystocktopick.com/public_html/index.php on line 141
Warning: DOMDocument::loadHTML(): Unexpected end tag : a in Entity, line: 237 in /home/u552734802/domains/dailystocktopick.com/public_html/index.php on line 141
Warning: DOMDocument::loadHTML(): Unexpected end tag : a in Entity, line: 237 in /home/u552734802/domains/dailystocktopick.com/public_html/index.php on line 141
Warning: DOMDocument::loadHTML(): Unexpected end tag : a in Entity, line: 237 in /home/u552734802/domains/dailystocktopick.com/public_html/index.php on line 141
Warning: DOMDocument::loadHTML(): Unexpected end tag : a in Entity, line: 237 in /home/u552734802/domains/dailystocktopick.com/public_html/index.php on line 141
Warning: DOMDocument::loadHTML(): Unexpected end tag : a in Entity, line: 237 in /home/u552734802/domains/dailystocktopick.com/public_html/index.php on line 141
Warning: DOMDocument::loadHTML(): Unexpected end tag : a in Entity, line: 237 in /home/u552734802/domains/dailystocktopick.com/public_html/index.php on line 141
Warning: DOMDocument::loadHTML(): Unexpected end tag : a in Entity, line: 237 in /home/u552734802/domains/dailystocktopick.com/public_html/index.php on line 141
Warning: DOMDocument::loadHTML(): Unexpected end tag : a in Entity, line: 237 in /home/u552734802/domains/dailystocktopick.com/public_html/index.php on line 141
Warning: DOMDocument::loadHTML(): Unexpected end tag : div in Entity, line: 237 in /home/u552734802/domains/dailystocktopick.com/public_html/index.php on line 141
Warning: DOMDocument::loadHTML(): Unexpected end tag : li in Entity, line: 237 in /home/u552734802/domains/dailystocktopick.com/public_html/index.php on line 141
Warning: DOMDocument::loadHTML(): Unexpected end tag : div in Entity, line: 237 in /home/u552734802/domains/dailystocktopick.com/public_html/index.php on line 141
Warning: DOMDocument::loadHTML(): Unexpected end tag : a in Entity, line: 237 in /home/u552734802/domains/dailystocktopick.com/public_html/index.php on line 141
Warning: DOMDocument::loadHTML(): Unexpected end tag : a in Entity, line: 237 in /home/u552734802/domains/dailystocktopick.com/public_html/index.php on line 141
Warning: DOMDocument::loadHTML(): Unexpected end tag : a in Entity, line: 237 in /home/u552734802/domains/dailystocktopick.com/public_html/index.php on line 141
Warning: DOMDocument::loadHTML(): Unexpected end tag : a in Entity, line: 237 in /home/u552734802/domains/dailystocktopick.com/public_html/index.php on line 141
Warning: DOMDocument::loadHTML(): Unexpected end tag : a in Entity, line: 237 in /home/u552734802/domains/dailystocktopick.com/public_html/index.php on line 141
Warning: DOMDocument::loadHTML(): Unexpected end tag : a in Entity, line: 237 in /home/u552734802/domains/dailystocktopick.com/public_html/index.php on line 141
Warning: DOMDocument::loadHTML(): Unexpected end tag : a in Entity, line: 237 in /home/u552734802/domains/dailystocktopick.com/public_html/index.php on line 141
Warning: DOMDocument::loadHTML(): Unexpected end tag : a in Entity, line: 237 in /home/u552734802/domains/dailystocktopick.com/public_html/index.php on line 141
Warning: DOMDocument::loadHTML(): Unexpected end tag : a in Entity, line: 237 in /home/u552734802/domains/dailystocktopick.com/public_html/index.php on line 141
Warning: DOMDocument::loadHTML(): Unexpected end tag : a in Entity, line: 237 in /home/u552734802/domains/dailystocktopick.com/public_html/index.php on line 141
Warning: DOMDocument::loadHTML(): Unexpected end tag : a in Entity, line: 237 in /home/u552734802/domains/dailystocktopick.com/public_html/index.php on line 141
Warning: DOMDocument::loadHTML(): Unexpected end tag : a in Entity, line: 237 in /home/u552734802/domains/dailystocktopick.com/public_html/index.php on line 141
Warning: DOMDocument::loadHTML(): Unexpected end tag : a in Entity, line: 237 in /home/u552734802/domains/dailystocktopick.com/public_html/index.php on line 141
Warning: DOMDocument::loadHTML(): Unexpected end tag : a in Entity, line: 237 in /home/u552734802/domains/dailystocktopick.com/public_html/index.php on line 141
Warning: DOMDocument::loadHTML(): Unexpected end tag : a in Entity, line: 237 in /home/u552734802/domains/dailystocktopick.com/public_html/index.php on line 141
Warning: DOMDocument::loadHTML(): Unexpected end tag : a in Entity, line: 237 in /home/u552734802/domains/dailystocktopick.com/public_html/index.php on line 141
Warning: DOMDocument::loadHTML(): Unexpected end tag : div in Entity, line: 237 in /home/u552734802/domains/dailystocktopick.com/public_html/index.php on line 141
Warning: DOMDocument::loadHTML(): Unexpected end tag : li in Entity, line: 237 in /home/u552734802/domains/dailystocktopick.com/public_html/index.php on line 141
Warning: DOMDocument::loadHTML(): Unexpected end tag : div in Entity, line: 237 in /home/u552734802/domains/dailystocktopick.com/public_html/index.php on line 141
Warning: DOMDocument::loadHTML(): Unexpected end tag : a in Entity, line: 237 in /home/u552734802/domains/dailystocktopick.com/public_html/index.php on line 141
Warning: DOMDocument::loadHTML(): Unexpected end tag : a in Entity, line: 237 in /home/u552734802/domains/dailystocktopick.com/public_html/index.php on line 141
Warning: DOMDocument::loadHTML(): Unexpected end tag : a in Entity, line: 237 in /home/u552734802/domains/dailystocktopick.com/public_html/index.php on line 141
Warning: DOMDocument::loadHTML(): Unexpected end tag : a in Entity, line: 237 in /home/u552734802/domains/dailystocktopick.com/public_html/index.php on line 141
Warning: DOMDocument::loadHTML(): Unexpected end tag : a in Entity, line: 237 in /home/u552734802/domains/dailystocktopick.com/public_html/index.php on line 141
Warning: DOMDocument::loadHTML(): Unexpected end tag : a in Entity, line: 237 in /home/u552734802/domains/dailystocktopick.com/public_html/index.php on line 141
Warning: DOMDocument::loadHTML(): Unexpected end tag : a in Entity, line: 237 in /home/u552734802/domains/dailystocktopick.com/public_html/index.php on line 141
Warning: DOMDocument::loadHTML(): Unexpected end tag : a in Entity, line: 237 in /home/u552734802/domains/dailystocktopick.com/public_html/index.php on line 141
Warning: DOMDocument::loadHTML(): Unexpected end tag : a in Entity, line: 237 in /home/u552734802/domains/dailystocktopick.com/public_html/index.php on line 141
Warning: DOMDocument::loadHTML(): Unexpected end tag : a in Entity, line: 237 in /home/u552734802/domains/dailystocktopick.com/public_html/index.php on line 141
Warning: DOMDocument::loadHTML(): Unexpected end tag : a in Entity, line: 237 in /home/u552734802/domains/dailystocktopick.com/public_html/index.php on line 141
Warning: DOMDocument::loadHTML(): Unexpected end tag : a in Entity, line: 237 in /home/u552734802/domains/dailystocktopick.com/public_html/index.php on line 141
Warning: DOMDocument::loadHTML(): Unexpected end tag : a in Entity, line: 237 in /home/u552734802/domains/dailystocktopick.com/public_html/index.php on line 141
Warning: DOMDocument::loadHTML(): Unexpected end tag : a in Entity, line: 237 in /home/u552734802/domains/dailystocktopick.com/public_html/index.php on line 141
Warning: DOMDocument::loadHTML(): Unexpected end tag : a in Entity, line: 237 in /home/u552734802/domains/dailystocktopick.com/public_html/index.php on line 141
Warning: DOMDocument::loadHTML(): Unexpected end tag : a in Entity, line: 237 in /home/u552734802/domains/dailystocktopick.com/public_html/index.php on line 141
Warning: DOMDocument::loadHTML(): Unexpected end tag : div in Entity, line: 237 in /home/u552734802/domains/dailystocktopick.com/public_html/index.php on line 141
Warning: DOMDocument::loadHTML(): Unexpected end tag : li in Entity, line: 237 in /home/u552734802/domains/dailystocktopick.com/public_html/index.php on line 141
Warning: DOMDocument::loadHTML(): Unexpected end tag : div in Entity, line: 237 in /home/u552734802/domains/dailystocktopick.com/public_html/index.php on line 141
Warning: DOMDocument::loadHTML(): Unexpected end tag : a in Entity, line: 237 in /home/u552734802/domains/dailystocktopick.com/public_html/index.php on line 141
Warning: DOMDocument::loadHTML(): Unexpected end tag : a in Entity, line: 237 in /home/u552734802/domains/dailystocktopick.com/public_html/index.php on line 141
Warning: DOMDocument::loadHTML(): Unexpected end tag : a in Entity, line: 237 in /home/u552734802/domains/dailystocktopick.com/public_html/index.php on line 141
Warning: DOMDocument::loadHTML(): Unexpected end tag : a in Entity, line: 237 in /home/u552734802/domains/dailystocktopick.com/public_html/index.php on line 141
Warning: DOMDocument::loadHTML(): Unexpected end tag : a in Entity, line: 237 in /home/u552734802/domains/dailystocktopick.com/public_html/index.php on line 141
Warning: DOMDocument::loadHTML(): Unexpected end tag : a in Entity, line: 237 in /home/u552734802/domains/dailystocktopick.com/public_html/index.php on line 141
Warning: DOMDocument::loadHTML(): Unexpected end tag : a in Entity, line: 237 in /home/u552734802/domains/dailystocktopick.com/public_html/index.php on line 141
Warning: DOMDocument::loadHTML(): Unexpected end tag : a in Entity, line: 237 in /home/u552734802/domains/dailystocktopick.com/public_html/index.php on line 141
Warning: DOMDocument::loadHTML(): Unexpected end tag : a in Entity, line: 237 in /home/u552734802/domains/dailystocktopick.com/public_html/index.php on line 141
Warning: DOMDocument::loadHTML(): Unexpected end tag : a in Entity, line: 237 in /home/u552734802/domains/dailystocktopick.com/public_html/index.php on line 141
Warning: DOMDocument::loadHTML(): Unexpected end tag : a in Entity, line: 237 in /home/u552734802/domains/dailystocktopick.com/public_html/index.php on line 141
Warning: DOMDocument::loadHTML(): Unexpected end tag : a in Entity, line: 237 in /home/u552734802/domains/dailystocktopick.com/public_html/index.php on line 141
Warning: DOMDocument::loadHTML(): Unexpected end tag : a in Entity, line: 237 in /home/u552734802/domains/dailystocktopick.com/public_html/index.php on line 141
Warning: DOMDocument::loadHTML(): Unexpected end tag : a in Entity, line: 237 in /home/u552734802/domains/dailystocktopick.com/public_html/index.php on line 141
Warning: DOMDocument::loadHTML(): Unexpected end tag : a in Entity, line: 237 in /home/u552734802/domains/dailystocktopick.com/public_html/index.php on line 141
Warning: DOMDocument::loadHTML(): Unexpected end tag : a in Entity, line: 237 in /home/u552734802/domains/dailystocktopick.com/public_html/index.php on line 141
Warning: DOMDocument::loadHTML(): Unexpected end tag : a in Entity, line: 237 in /home/u552734802/domains/dailystocktopick.com/public_html/index.php on line 141
Warning: DOMDocument::loadHTML(): Unexpected end tag : a in Entity, line: 237 in /home/u552734802/domains/dailystocktopick.com/public_html/index.php on line 141
Warning: DOMDocument::loadHTML(): Unexpected end tag : div in Entity, line: 237 in /home/u552734802/domains/dailystocktopick.com/public_html/index.php on line 141
Warning: DOMDocument::loadHTML(): Unexpected end tag : li in Entity, line: 237 in /home/u552734802/domains/dailystocktopick.com/public_html/index.php on line 141
Warning: DOMDocument::loadHTML(): Unexpected end tag : div in Entity, line: 237 in /home/u552734802/domains/dailystocktopick.com/public_html/index.php on line 141
Warning: DOMDocument::loadHTML(): Unexpected end tag : a in Entity, line: 237 in /home/u552734802/domains/dailystocktopick.com/public_html/index.php on line 141
Warning: DOMDocument::loadHTML(): Unexpected end tag : a in Entity, line: 237 in /home/u552734802/domains/dailystocktopick.com/public_html/index.php on line 141
Warning: DOMDocument::loadHTML(): Unexpected end tag : a in Entity, line: 237 in /home/u552734802/domains/dailystocktopick.com/public_html/index.php on line 141
Warning: DOMDocument::loadHTML(): Unexpected end tag : a in Entity, line: 237 in /home/u552734802/domains/dailystocktopick.com/public_html/index.php on line 141
Warning: DOMDocument::loadHTML(): Unexpected end tag : a in Entity, line: 237 in /home/u552734802/domains/dailystocktopick.com/public_html/index.php on line 141
Warning: DOMDocument::loadHTML(): Unexpected end tag : a in Entity, line: 237 in /home/u552734802/domains/dailystocktopick.com/public_html/index.php on line 141
Warning: DOMDocument::loadHTML(): Unexpected end tag : a in Entity, line: 237 in /home/u552734802/domains/dailystocktopick.com/public_html/index.php on line 141
Warning: DOMDocument::loadHTML(): Unexpected end tag : a in Entity, line: 237 in /home/u552734802/domains/dailystocktopick.com/public_html/index.php on line 141
Warning: DOMDocument::loadHTML(): Unexpected end tag : a in Entity, line: 237 in /home/u552734802/domains/dailystocktopick.com/public_html/index.php on line 141
Warning: DOMDocument::loadHTML(): Unexpected end tag : a in Entity, line: 237 in /home/u552734802/domains/dailystocktopick.com/public_html/index.php on line 141
Warning: DOMDocument::loadHTML(): Unexpected end tag : div in Entity, line: 237 in /home/u552734802/domains/dailystocktopick.com/public_html/index.php on line 141
Warning: DOMDocument::loadHTML(): Unexpected end tag : li in Entity, line: 237 in /home/u552734802/domains/dailystocktopick.com/public_html/index.php on line 141
Warning: DOMDocument::loadHTML(): Unexpected end tag : div in Entity, line: 237 in /home/u552734802/domains/dailystocktopick.com/public_html/index.php on line 141
Warning: DOMDocument::loadHTML(): Unexpected end tag : a in Entity, line: 237 in /home/u552734802/domains/dailystocktopick.com/public_html/index.php on line 141
Warning: DOMDocument::loadHTML(): Unexpected end tag : a in Entity, line: 237 in /home/u552734802/domains/dailystocktopick.com/public_html/index.php on line 141
Warning: DOMDocument::loadHTML(): Unexpected end tag : a in Entity, line: 237 in /home/u552734802/domains/dailystocktopick.com/public_html/index.php on line 141
Warning: DOMDocument::loadHTML(): Unexpected end tag : a in Entity, line: 237 in /home/u552734802/domains/dailystocktopick.com/public_html/index.php on line 141
Warning: DOMDocument::loadHTML(): Unexpected end tag : a in Entity, line: 237 in /home/u552734802/domains/dailystocktopick.com/public_html/index.php on line 141
Warning: DOMDocument::loadHTML(): Unexpected end tag : a in Entity, line: 237 in /home/u552734802/domains/dailystocktopick.com/public_html/index.php on line 141
Warning: DOMDocument::loadHTML(): Unexpected end tag : a in Entity, line: 237 in /home/u552734802/domains/dailystocktopick.com/public_html/index.php on line 141
Warning: DOMDocument::loadHTML(): Unexpected end tag : a in Entity, line: 237 in /home/u552734802/domains/dailystocktopick.com/public_html/index.php on line 141
Warning: DOMDocument::loadHTML(): Unexpected end tag : a in Entity, line: 237 in /home/u552734802/domains/dailystocktopick.com/public_html/index.php on line 141
Warning: DOMDocument::loadHTML(): Unexpected end tag : a in Entity, line: 237 in /home/u552734802/domains/dailystocktopick.com/public_html/index.php on line 141
Warning: DOMDocument::loadHTML(): Unexpected end tag : div in Entity, line: 237 in /home/u552734802/domains/dailystocktopick.com/public_html/index.php on line 141
Warning: DOMDocument::loadHTML(): Unexpected end tag : li in Entity, line: 237 in /home/u552734802/domains/dailystocktopick.com/public_html/index.php on line 141
Warning: DOMDocument::loadHTML(): Unexpected end tag : div in Entity, line: 237 in /home/u552734802/domains/dailystocktopick.com/public_html/index.php on line 141
Warning: DOMDocument::loadHTML(): Unexpected end tag : a in Entity, line: 237 in /home/u552734802/domains/dailystocktopick.com/public_html/index.php on line 141
Warning: DOMDocument::loadHTML(): Unexpected end tag : a in Entity, line: 237 in /home/u552734802/domains/dailystocktopick.com/public_html/index.php on line 141
Warning: DOMDocument::loadHTML(): Unexpected end tag : a in Entity, line: 237 in /home/u552734802/domains/dailystocktopick.com/public_html/index.php on line 141
Warning: DOMDocument::loadHTML(): Unexpected end tag : a in Entity, line: 237 in /home/u552734802/domains/dailystocktopick.com/public_html/index.php on line 141
Warning: DOMDocument::loadHTML(): Unexpected end tag : a in Entity, line: 237 in /home/u552734802/domains/dailystocktopick.com/public_html/index.php on line 141
Warning: DOMDocument::loadHTML(): Unexpected end tag : a in Entity, line: 237 in /home/u552734802/domains/dailystocktopick.com/public_html/index.php on line 141
Warning: DOMDocument::loadHTML(): Unexpected end tag : a in Entity, line: 237 in /home/u552734802/domains/dailystocktopick.com/public_html/index.php on line 141
Warning: DOMDocument::loadHTML(): Unexpected end tag : a in Entity, line: 237 in /home/u552734802/domains/dailystocktopick.com/public_html/index.php on line 141
Warning: DOMDocument::loadHTML(): Unexpected end tag : a in Entity, line: 237 in /home/u552734802/domains/dailystocktopick.com/public_html/index.php on line 141
Warning: DOMDocument::loadHTML(): Unexpected end tag : a in Entity, line: 237 in /home/u552734802/domains/dailystocktopick.com/public_html/index.php on line 141
Warning: DOMDocument::loadHTML(): Unexpected end tag : a in Entity, line: 237 in /home/u552734802/domains/dailystocktopick.com/public_html/index.php on line 141
Warning: DOMDocument::loadHTML(): Unexpected end tag : div in Entity, line: 237 in /home/u552734802/domains/dailystocktopick.com/public_html/index.php on line 141
Warning: DOMDocument::loadHTML(): Unexpected end tag : li in Entity, line: 237 in /home/u552734802/domains/dailystocktopick.com/public_html/index.php on line 141
Warning: DOMDocument::loadHTML(): Unexpected end tag : div in Entity, line: 237 in /home/u552734802/domains/dailystocktopick.com/public_html/index.php on line 141
Warning: DOMDocument::loadHTML(): Unexpected end tag : a in Entity, line: 237 in /home/u552734802/domains/dailystocktopick.com/public_html/index.php on line 141
Warning: DOMDocument::loadHTML(): Unexpected end tag : a in Entity, line: 237 in /home/u552734802/domains/dailystocktopick.com/public_html/index.php on line 141
Warning: DOMDocument::loadHTML(): Unexpected end tag : a in Entity, line: 237 in /home/u552734802/domains/dailystocktopick.com/public_html/index.php on line 141
Warning: DOMDocument::loadHTML(): Unexpected end tag : a in Entity, line: 237 in /home/u552734802/domains/dailystocktopick.com/public_html/index.php on line 141
Warning: DOMDocument::loadHTML(): Unexpected end tag : a in Entity, line: 237 in /home/u552734802/domains/dailystocktopick.com/public_html/index.php on line 141
Warning: DOMDocument::loadHTML(): Unexpected end tag : a in Entity, line: 237 in /home/u552734802/domains/dailystocktopick.com/public_html/index.php on line 141
Warning: DOMDocument::loadHTML(): Unexpected end tag : a in Entity, line: 237 in /home/u552734802/domains/dailystocktopick.com/public_html/index.php on line 141
Warning: DOMDocument::loadHTML(): Unexpected end tag : a in Entity, line: 237 in /home/u552734802/domains/dailystocktopick.com/public_html/index.php on line 141
Warning: DOMDocument::loadHTML(): Unexpected end tag : a in Entity, line: 237 in /home/u552734802/domains/dailystocktopick.com/public_html/index.php on line 141
Warning: DOMDocument::loadHTML(): Unexpected end tag : a in Entity, line: 237 in /home/u552734802/domains/dailystocktopick.com/public_html/index.php on line 141
Warning: DOMDocument::loadHTML(): Unexpected end tag : a in Entity, line: 237 in /home/u552734802/domains/dailystocktopick.com/public_html/index.php on line 141
Warning: DOMDocument::loadHTML(): Unexpected end tag : a in Entity, line: 237 in /home/u552734802/domains/dailystocktopick.com/public_html/index.php on line 141
Warning: DOMDocument::loadHTML(): Unexpected end tag : a in Entity, line: 237 in /home/u552734802/domains/dailystocktopick.com/public_html/index.php on line 141
Warning: DOMDocument::loadHTML(): Unexpected end tag : a in Entity, line: 237 in /home/u552734802/domains/dailystocktopick.com/public_html/index.php on line 141
Warning: DOMDocument::loadHTML(): Unexpected end tag : a in Entity, line: 237 in /home/u552734802/domains/dailystocktopick.com/public_html/index.php on line 141
Warning: DOMDocument::loadHTML(): Unexpected end tag : a in Entity, line: 237 in /home/u552734802/domains/dailystocktopick.com/public_html/index.php on line 141
Warning: DOMDocument::loadHTML(): Unexpected end tag : a in Entity, line: 237 in /home/u552734802/domains/dailystocktopick.com/public_html/index.php on line 141
Warning: DOMDocument::loadHTML(): Unexpected end tag : div in Entity, line: 237 in /home/u552734802/domains/dailystocktopick.com/public_html/index.php on line 141
Warning: DOMDocument::loadHTML(): Unexpected end tag : li in Entity, line: 237 in /home/u552734802/domains/dailystocktopick.com/public_html/index.php on line 141
Warning: DOMDocument::loadHTML(): Unexpected end tag : div in Entity, line: 237 in /home/u552734802/domains/dailystocktopick.com/public_html/index.php on line 141
Warning: DOMDocument::loadHTML(): Unexpected end tag : a in Entity, line: 237 in /home/u552734802/domains/dailystocktopick.com/public_html/index.php on line 141
Warning: DOMDocument::loadHTML(): Unexpected end tag : a in Entity, line: 237 in /home/u552734802/domains/dailystocktopick.com/public_html/index.php on line 141
Warning: DOMDocument::loadHTML(): Unexpected end tag : a in Entity, line: 237 in /home/u552734802/domains/dailystocktopick.com/public_html/index.php on line 141
Warning: DOMDocument::loadHTML(): Unexpected end tag : a in Entity, line: 237 in /home/u552734802/domains/dailystocktopick.com/public_html/index.php on line 141
Warning: DOMDocument::loadHTML(): Unexpected end tag : a in Entity, line: 237 in /home/u552734802/domains/dailystocktopick.com/public_html/index.php on line 141
Warning: DOMDocument::loadHTML(): Unexpected end tag : a in Entity, line: 237 in /home/u552734802/domains/dailystocktopick.com/public_html/index.php on line 141
Warning: DOMDocument::loadHTML(): Unexpected end tag : a in Entity, line: 237 in /home/u552734802/domains/dailystocktopick.com/public_html/index.php on line 141
Warning: DOMDocument::loadHTML(): Unexpected end tag : a in Entity, line: 237 in /home/u552734802/domains/dailystocktopick.com/public_html/index.php on line 141
Warning: DOMDocument::loadHTML(): Unexpected end tag : a in Entity, line: 237 in /home/u552734802/domains/dailystocktopick.com/public_html/index.php on line 141
Warning: DOMDocument::loadHTML(): Unexpected end tag : a in Entity, line: 237 in /home/u552734802/domains/dailystocktopick.com/public_html/index.php on line 141
Warning: DOMDocument::loadHTML(): Unexpected end tag : a in Entity, line: 237 in /home/u552734802/domains/dailystocktopick.com/public_html/index.php on line 141
Warning: DOMDocument::loadHTML(): Unexpected end tag : a in Entity, line: 237 in /home/u552734802/domains/dailystocktopick.com/public_html/index.php on line 141
Warning: DOMDocument::loadHTML(): Unexpected end tag : a in Entity, line: 237 in /home/u552734802/domains/dailystocktopick.com/public_html/index.php on line 141
Warning: DOMDocument::loadHTML(): Unexpected end tag : div in Entity, line: 237 in /home/u552734802/domains/dailystocktopick.com/public_html/index.php on line 141
Warning: DOMDocument::loadHTML(): Unexpected end tag : li in Entity, line: 237 in /home/u552734802/domains/dailystocktopick.com/public_html/index.php on line 141
Warning: DOMDocument::loadHTML(): Unexpected end tag : div in Entity, line: 237 in /home/u552734802/domains/dailystocktopick.com/public_html/index.php on line 141
Warning: DOMDocument::loadHTML(): Unexpected end tag : a in Entity, line: 237 in /home/u552734802/domains/dailystocktopick.com/public_html/index.php on line 141
Warning: DOMDocument::loadHTML(): Unexpected end tag : a in Entity, line: 237 in /home/u552734802/domains/dailystocktopick.com/public_html/index.php on line 141
Warning: DOMDocument::loadHTML(): Unexpected end tag : a in Entity, line: 237 in /home/u552734802/domains/dailystocktopick.com/public_html/index.php on line 141
Warning: DOMDocument::loadHTML(): Unexpected end tag : a in Entity, line: 237 in /home/u552734802/domains/dailystocktopick.com/public_html/index.php on line 141
Warning: DOMDocument::loadHTML(): Unexpected end tag : a in Entity, line: 237 in /home/u552734802/domains/dailystocktopick.com/public_html/index.php on line 141
Warning: DOMDocument::loadHTML(): Unexpected end tag : a in Entity, line: 237 in /home/u552734802/domains/dailystocktopick.com/public_html/index.php on line 141
Warning: DOMDocument::loadHTML(): Unexpected end tag : a in Entity, line: 237 in /home/u552734802/domains/dailystocktopick.com/public_html/index.php on line 141
Warning: DOMDocument::loadHTML(): Unexpected end tag : a in Entity, line: 237 in /home/u552734802/domains/dailystocktopick.com/public_html/index.php on line 141
Warning: DOMDocument::loadHTML(): Unexpected end tag : a in Entity, line: 237 in /home/u552734802/domains/dailystocktopick.com/public_html/index.php on line 141
Warning: DOMDocument::loadHTML(): Unexpected end tag : a in Entity, line: 237 in /home/u552734802/domains/dailystocktopick.com/public_html/index.php on line 141
Warning: DOMDocument::loadHTML(): Unexpected end tag : a in Entity, line: 237 in /home/u552734802/domains/dailystocktopick.com/public_html/index.php on line 141
Warning: DOMDocument::loadHTML(): Unexpected end tag : a in Entity, line: 237 in /home/u552734802/domains/dailystocktopick.com/public_html/index.php on line 141
Warning: DOMDocument::loadHTML(): Unexpected end tag : a in Entity, line: 237 in /home/u552734802/domains/dailystocktopick.com/public_html/index.php on line 141
Warning: DOMDocument::loadHTML(): Unexpected end tag : a in Entity, line: 237 in /home/u552734802/domains/dailystocktopick.com/public_html/index.php on line 141
Warning: DOMDocument::loadHTML(): Unexpected end tag : a in Entity, line: 237 in /home/u552734802/domains/dailystocktopick.com/public_html/index.php on line 141
Warning: DOMDocument::loadHTML(): Unexpected end tag : div in Entity, line: 237 in /home/u552734802/domains/dailystocktopick.com/public_html/index.php on line 141
Warning: DOMDocument::loadHTML(): Unexpected end tag : li in Entity, line: 237 in /home/u552734802/domains/dailystocktopick.com/public_html/index.php on line 141
Warning: DOMDocument::loadHTML(): Unexpected end tag : div in Entity, line: 237 in /home/u552734802/domains/dailystocktopick.com/public_html/index.php on line 141
Warning: DOMDocument::loadHTML(): Unexpected end tag : a in Entity, line: 237 in /home/u552734802/domains/dailystocktopick.com/public_html/index.php on line 141
Warning: DOMDocument::loadHTML(): Unexpected end tag : a in Entity, line: 237 in /home/u552734802/domains/dailystocktopick.com/public_html/index.php on line 141
Warning: DOMDocument::loadHTML(): Unexpected end tag : a in Entity, line: 237 in /home/u552734802/domains/dailystocktopick.com/public_html/index.php on line 141
Warning: DOMDocument::loadHTML(): Unexpected end tag : a in Entity, line: 237 in /home/u552734802/domains/dailystocktopick.com/public_html/index.php on line 141
Warning: DOMDocument::loadHTML(): Unexpected end tag : a in Entity, line: 237 in /home/u552734802/domains/dailystocktopick.com/public_html/index.php on line 141
Warning: DOMDocument::loadHTML(): Unexpected end tag : a in Entity, line: 237 in /home/u552734802/domains/dailystocktopick.com/public_html/index.php on line 141
Warning: DOMDocument::loadHTML(): Unexpected end tag : a in Entity, line: 237 in /home/u552734802/domains/dailystocktopick.com/public_html/index.php on line 141
Warning: DOMDocument::loadHTML(): Unexpected end tag : a in Entity, line: 237 in /home/u552734802/domains/dailystocktopick.com/public_html/index.php on line 141
Warning: DOMDocument::loadHTML(): Unexpected end tag : a in Entity, line: 237 in /home/u552734802/domains/dailystocktopick.com/public_html/index.php on line 141
Warning: DOMDocument::loadHTML(): Unexpected end tag : a in Entity, line: 237 in /home/u552734802/domains/dailystocktopick.com/public_html/index.php on line 141
Warning: DOMDocument::loadHTML(): Unexpected end tag : div in Entity, line: 237 in /home/u552734802/domains/dailystocktopick.com/public_html/index.php on line 141
Warning: DOMDocument::loadHTML(): Unexpected end tag : li in Entity, line: 237 in /home/u552734802/domains/dailystocktopick.com/public_html/index.php on line 141
Warning: DOMDocument::loadHTML(): Unexpected end tag : div in Entity, line: 237 in /home/u552734802/domains/dailystocktopick.com/public_html/index.php on line 141
Warning: DOMDocument::loadHTML(): Unexpected end tag : a in Entity, line: 237 in /home/u552734802/domains/dailystocktopick.com/public_html/index.php on line 141
Warning: DOMDocument::loadHTML(): Unexpected end tag : a in Entity, line: 237 in /home/u552734802/domains/dailystocktopick.com/public_html/index.php on line 141
Warning: DOMDocument::loadHTML(): Unexpected end tag : a in Entity, line: 237 in /home/u552734802/domains/dailystocktopick.com/public_html/index.php on line 141
Warning: DOMDocument::loadHTML(): Unexpected end tag : a in Entity, line: 237 in /home/u552734802/domains/dailystocktopick.com/public_html/index.php on line 141
Warning: DOMDocument::loadHTML(): Unexpected end tag : a in Entity, line: 237 in /home/u552734802/domains/dailystocktopick.com/public_html/index.php on line 141
Warning: DOMDocument::loadHTML(): Unexpected end tag : a in Entity, line: 237 in /home/u552734802/domains/dailystocktopick.com/public_html/index.php on line 141
Warning: DOMDocument::loadHTML(): Unexpected end tag : a in Entity, line: 237 in /home/u552734802/domains/dailystocktopick.com/public_html/index.php on line 141
Warning: DOMDocument::loadHTML(): Unexpected end tag : a in Entity, line: 237 in /home/u552734802/domains/dailystocktopick.com/public_html/index.php on line 141
Warning: DOMDocument::loadHTML(): Unexpected end tag : a in Entity, line: 237 in /home/u552734802/domains/dailystocktopick.com/public_html/index.php on line 141
Warning: DOMDocument::loadHTML(): Unexpected end tag : a in Entity, line: 237 in /home/u552734802/domains/dailystocktopick.com/public_html/index.php on line 141
Warning: DOMDocument::loadHTML(): Unexpected end tag : a in Entity, line: 237 in /home/u552734802/domains/dailystocktopick.com/public_html/index.php on line 141
Warning: DOMDocument::loadHTML(): Unexpected end tag : a in Entity, line: 237 in /home/u552734802/domains/dailystocktopick.com/public_html/index.php on line 141
Warning: DOMDocument::loadHTML(): Unexpected end tag : a in Entity, line: 237 in /home/u552734802/domains/dailystocktopick.com/public_html/index.php on line 141
Warning: DOMDocument::loadHTML(): Unexpected end tag : a in Entity, line: 237 in /home/u552734802/domains/dailystocktopick.com/public_html/index.php on line 141
Warning: DOMDocument::loadHTML(): Unexpected end tag : a in Entity, line: 237 in /home/u552734802/domains/dailystocktopick.com/public_html/index.php on line 141
Warning: DOMDocument::loadHTML(): Unexpected end tag : a in Entity, line: 237 in /home/u552734802/domains/dailystocktopick.com/public_html/index.php on line 141
Warning: DOMDocument::loadHTML(): Unexpected end tag : a in Entity, line: 237 in /home/u552734802/domains/dailystocktopick.com/public_html/index.php on line 141
Warning: DOMDocument::loadHTML(): Unexpected end tag : a in Entity, line: 237 in /home/u552734802/domains/dailystocktopick.com/public_html/index.php on line 141
Warning: DOMDocument::loadHTML(): Unexpected end tag : a in Entity, line: 237 in /home/u552734802/domains/dailystocktopick.com/public_html/index.php on line 141
Warning: DOMDocument::loadHTML(): Unexpected end tag : div in Entity, line: 237 in /home/u552734802/domains/dailystocktopick.com/public_html/index.php on line 141
Warning: DOMDocument::loadHTML(): Unexpected end tag : li in Entity, line: 237 in /home/u552734802/domains/dailystocktopick.com/public_html/index.php on line 141
Warning: DOMDocument::loadHTML(): Unexpected end tag : div in Entity, line: 237 in /home/u552734802/domains/dailystocktopick.com/public_html/index.php on line 141
Warning: DOMDocument::loadHTML(): Unexpected end tag : a in Entity, line: 237 in /home/u552734802/domains/dailystocktopick.com/public_html/index.php on line 141
Warning: DOMDocument::loadHTML(): Unexpected end tag : a in Entity, line: 237 in /home/u552734802/domains/dailystocktopick.com/public_html/index.php on line 141
Warning: DOMDocument::loadHTML(): Unexpected end tag : a in Entity, line: 237 in /home/u552734802/domains/dailystocktopick.com/public_html/index.php on line 141
Warning: DOMDocument::loadHTML(): Unexpected end tag : a in Entity, line: 237 in /home/u552734802/domains/dailystocktopick.com/public_html/index.php on line 141
Warning: DOMDocument::loadHTML(): Unexpected end tag : a in Entity, line: 237 in /home/u552734802/domains/dailystocktopick.com/public_html/index.php on line 141
Warning: DOMDocument::loadHTML(): Unexpected end tag : a in Entity, line: 237 in /home/u552734802/domains/dailystocktopick.com/public_html/index.php on line 141
Warning: DOMDocument::loadHTML(): Unexpected end tag : a in Entity, line: 237 in /home/u552734802/domains/dailystocktopick.com/public_html/index.php on line 141
Warning: DOMDocument::loadHTML(): Unexpected end tag : a in Entity, line: 237 in /home/u552734802/domains/dailystocktopick.com/public_html/index.php on line 141
Warning: DOMDocument::loadHTML(): Unexpected end tag : a in Entity, line: 237 in /home/u552734802/domains/dailystocktopick.com/public_html/index.php on line 141
Warning: DOMDocument::loadHTML(): Unexpected end tag : a in Entity, line: 237 in /home/u552734802/domains/dailystocktopick.com/public_html/index.php on line 141
Warning: DOMDocument::loadHTML(): Unexpected end tag : a in Entity, line: 237 in /home/u552734802/domains/dailystocktopick.com/public_html/index.php on line 141
Warning: DOMDocument::loadHTML(): Unexpected end tag : a in Entity, line: 237 in /home/u552734802/domains/dailystocktopick.com/public_html/index.php on line 141
Warning: DOMDocument::loadHTML(): Unexpected end tag : a in Entity, line: 237 in /home/u552734802/domains/dailystocktopick.com/public_html/index.php on line 141
Warning: DOMDocument::loadHTML(): Unexpected end tag : div in Entity, line: 237 in /home/u552734802/domains/dailystocktopick.com/public_html/index.php on line 141
Warning: DOMDocument::loadHTML(): Unexpected end tag : li in Entity, line: 237 in /home/u552734802/domains/dailystocktopick.com/public_html/index.php on line 141
Warning: DOMDocument::loadHTML(): Unexpected end tag : div in Entity, line: 237 in /home/u552734802/domains/dailystocktopick.com/public_html/index.php on line 141
Warning: DOMDocument::loadHTML(): Unexpected end tag : a in Entity, line: 237 in /home/u552734802/domains/dailystocktopick.com/public_html/index.php on line 141
Warning: DOMDocument::loadHTML(): Unexpected end tag : a in Entity, line: 237 in /home/u552734802/domains/dailystocktopick.com/public_html/index.php on line 141
Warning: DOMDocument::loadHTML(): Unexpected end tag : a in Entity, line: 237 in /home/u552734802/domains/dailystocktopick.com/public_html/index.php on line 141
Warning: DOMDocument::loadHTML(): Unexpected end tag : a in Entity, line: 237 in /home/u552734802/domains/dailystocktopick.com/public_html/index.php on line 141
Warning: DOMDocument::loadHTML(): Unexpected end tag : a in Entity, line: 237 in /home/u552734802/domains/dailystocktopick.com/public_html/index.php on line 141
Warning: DOMDocument::loadHTML(): Unexpected end tag : a in Entity, line: 237 in /home/u552734802/domains/dailystocktopick.com/public_html/index.php on line 141
Warning: DOMDocument::loadHTML(): Unexpected end tag : a in Entity, line: 237 in /home/u552734802/domains/dailystocktopick.com/public_html/index.php on line 141
Warning: DOMDocument::loadHTML(): Unexpected end tag : a in Entity, line: 237 in /home/u552734802/domains/dailystocktopick.com/public_html/index.php on line 141
Warning: DOMDocument::loadHTML(): Unexpected end tag : div in Entity, line: 237 in /home/u552734802/domains/dailystocktopick.com/public_html/index.php on line 141
Warning: DOMDocument::loadHTML(): Unexpected end tag : li in Entity, line: 237 in /home/u552734802/domains/dailystocktopick.com/public_html/index.php on line 141
Warning: DOMDocument::loadHTML(): Unexpected end tag : div in Entity, line: 237 in /home/u552734802/domains/dailystocktopick.com/public_html/index.php on line 141
Warning: DOMDocument::loadHTML(): Unexpected end tag : a in Entity, line: 237 in /home/u552734802/domains/dailystocktopick.com/public_html/index.php on line 141
Warning: DOMDocument::loadHTML(): Unexpected end tag : a in Entity, line: 237 in /home/u552734802/domains/dailystocktopick.com/public_html/index.php on line 141
Warning: DOMDocument::loadHTML(): Unexpected end tag : a in Entity, line: 237 in /home/u552734802/domains/dailystocktopick.com/public_html/index.php on line 141
Warning: DOMDocument::loadHTML(): Unexpected end tag : a in Entity, line: 237 in /home/u552734802/domains/dailystocktopick.com/public_html/index.php on line 141
Warning: DOMDocument::loadHTML(): Unexpected end tag : a in Entity, line: 237 in /home/u552734802/domains/dailystocktopick.com/public_html/index.php on line 141
Warning: DOMDocument::loadHTML(): Unexpected end tag : a in Entity, line: 237 in /home/u552734802/domains/dailystocktopick.com/public_html/index.php on line 141
Warning: DOMDocument::loadHTML(): Unexpected end tag : a in Entity, line: 237 in /home/u552734802/domains/dailystocktopick.com/public_html/index.php on line 141
Warning: DOMDocument::loadHTML(): Unexpected end tag : a in Entity, line: 237 in /home/u552734802/domains/dailystocktopick.com/public_html/index.php on line 141
Warning: DOMDocument::loadHTML(): Unexpected end tag : a in Entity, line: 237 in /home/u552734802/domains/dailystocktopick.com/public_html/index.php on line 141
Warning: DOMDocument::loadHTML(): Unexpected end tag : a in Entity, line: 237 in /home/u552734802/domains/dailystocktopick.com/public_html/index.php on line 141
Warning: DOMDocument::loadHTML(): Unexpected end tag : a in Entity, line: 237 in /home/u552734802/domains/dailystocktopick.com/public_html/index.php on line 141
Warning: DOMDocument::loadHTML(): Unexpected end tag : a in Entity, line: 237 in /home/u552734802/domains/dailystocktopick.com/public_html/index.php on line 141
Warning: DOMDocument::loadHTML(): Unexpected end tag : a in Entity, line: 237 in /home/u552734802/domains/dailystocktopick.com/public_html/index.php on line 141
Warning: DOMDocument::loadHTML(): Unexpected end tag : a in Entity, line: 237 in /home/u552734802/domains/dailystocktopick.com/public_html/index.php on line 141
Warning: DOMDocument::loadHTML(): Unexpected end tag : a in Entity, line: 237 in /home/u552734802/domains/dailystocktopick.com/public_html/index.php on line 141
Warning: DOMDocument::loadHTML(): Unexpected end tag : a in Entity, line: 237 in /home/u552734802/domains/dailystocktopick.com/public_html/index.php on line 141
Warning: DOMDocument::loadHTML(): Unexpected end tag : div in Entity, line: 237 in /home/u552734802/domains/dailystocktopick.com/public_html/index.php on line 141
Warning: DOMDocument::loadHTML(): Unexpected end tag : li in Entity, line: 237 in /home/u552734802/domains/dailystocktopick.com/public_html/index.php on line 141
Warning: DOMDocument::loadHTML(): Unexpected end tag : div in Entity, line: 237 in /home/u552734802/domains/dailystocktopick.com/public_html/index.php on line 141
Warning: DOMDocument::loadHTML(): Unexpected end tag : a in Entity, line: 237 in /home/u552734802/domains/dailystocktopick.com/public_html/index.php on line 141
Warning: DOMDocument::loadHTML(): Unexpected end tag : a in Entity, line: 237 in /home/u552734802/domains/dailystocktopick.com/public_html/index.php on line 141
Warning: DOMDocument::loadHTML(): Unexpected end tag : a in Entity, line: 237 in /home/u552734802/domains/dailystocktopick.com/public_html/index.php on line 141
Warning: DOMDocument::loadHTML(): Unexpected end tag : a in Entity, line: 237 in /home/u552734802/domains/dailystocktopick.com/public_html/index.php on line 141
Warning: DOMDocument::loadHTML(): Unexpected end tag : a in Entity, line: 237 in /home/u552734802/domains/dailystocktopick.com/public_html/index.php on line 141
Warning: DOMDocument::loadHTML(): Unexpected end tag : a in Entity, line: 237 in /home/u552734802/domains/dailystocktopick.com/public_html/index.php on line 141
Warning: DOMDocument::loadHTML(): Unexpected end tag : a in Entity, line: 237 in /home/u552734802/domains/dailystocktopick.com/public_html/index.php on line 141
Warning: DOMDocument::loadHTML(): Unexpected end tag : a in Entity, line: 237 in /home/u552734802/domains/dailystocktopick.com/public_html/index.php on line 141
Warning: DOMDocument::loadHTML(): Unexpected end tag : a in Entity, line: 237 in /home/u552734802/domains/dailystocktopick.com/public_html/index.php on line 141
Warning: DOMDocument::loadHTML(): Unexpected end tag : a in Entity, line: 237 in /home/u552734802/domains/dailystocktopick.com/public_html/index.php on line 141
Warning: DOMDocument::loadHTML(): Unexpected end tag : a in Entity, line: 237 in /home/u552734802/domains/dailystocktopick.com/public_html/index.php on line 141
Warning: DOMDocument::loadHTML(): Unexpected end tag : a in Entity, line: 237 in /home/u552734802/domains/dailystocktopick.com/public_html/index.php on line 141
Warning: DOMDocument::loadHTML(): Unexpected end tag : a in Entity, line: 237 in /home/u552734802/domains/dailystocktopick.com/public_html/index.php on line 141
Warning: DOMDocument::loadHTML(): Unexpected end tag : a in Entity, line: 237 in /home/u552734802/domains/dailystocktopick.com/public_html/index.php on line 141
Warning: DOMDocument::loadHTML(): Unexpected end tag : a in Entity, line: 237 in /home/u552734802/domains/dailystocktopick.com/public_html/index.php on line 141
Warning: DOMDocument::loadHTML(): Unexpected end tag : div in Entity, line: 237 in /home/u552734802/domains/dailystocktopick.com/public_html/index.php on line 141
Warning: DOMDocument::loadHTML(): Unexpected end tag : li in Entity, line: 237 in /home/u552734802/domains/dailystocktopick.com/public_html/index.php on line 141
Warning: DOMDocument::loadHTML(): Unexpected end tag : div in Entity, line: 237 in /home/u552734802/domains/dailystocktopick.com/public_html/index.php on line 141
Warning: DOMDocument::loadHTML(): Unexpected end tag : a in Entity, line: 237 in /home/u552734802/domains/dailystocktopick.com/public_html/index.php on line 141
Warning: DOMDocument::loadHTML(): Unexpected end tag : a in Entity, line: 237 in /home/u552734802/domains/dailystocktopick.com/public_html/index.php on line 141
Warning: DOMDocument::loadHTML(): Unexpected end tag : a in Entity, line: 237 in /home/u552734802/domains/dailystocktopick.com/public_html/index.php on line 141
Warning: DOMDocument::loadHTML(): Unexpected end tag : a in Entity, line: 237 in /home/u552734802/domains/dailystocktopick.com/public_html/index.php on line 141
Warning: DOMDocument::loadHTML(): Unexpected end tag : a in Entity, line: 237 in /home/u552734802/domains/dailystocktopick.com/public_html/index.php on line 141
Warning: DOMDocument::loadHTML(): Unexpected end tag : a in Entity, line: 237 in /home/u552734802/domains/dailystocktopick.com/public_html/index.php on line 141
Warning: DOMDocument::loadHTML(): Unexpected end tag : a in Entity, line: 237 in /home/u552734802/domains/dailystocktopick.com/public_html/index.php on line 141
Warning: DOMDocument::loadHTML(): Unexpected end tag : a in Entity, line: 237 in /home/u552734802/domains/dailystocktopick.com/public_html/index.php on line 141
Warning: DOMDocument::loadHTML(): Unexpected end tag : a in Entity, line: 237 in /home/u552734802/domains/dailystocktopick.com/public_html/index.php on line 141
Warning: DOMDocument::loadHTML(): Unexpected end tag : a in Entity, line: 237 in /home/u552734802/domains/dailystocktopick.com/public_html/index.php on line 141
Warning: DOMDocument::loadHTML(): Unexpected end tag : a in Entity, line: 237 in /home/u552734802/domains/dailystocktopick.com/public_html/index.php on line 141
Warning: DOMDocument::loadHTML(): Unexpected end tag : a in Entity, line: 237 in /home/u552734802/domains/dailystocktopick.com/public_html/index.php on line 141
Warning: DOMDocument::loadHTML(): Unexpected end tag : a in Entity, line: 237 in /home/u552734802/domains/dailystocktopick.com/public_html/index.php on line 141
Warning: DOMDocument::loadHTML(): Unexpected end tag : a in Entity, line: 237 in /home/u552734802/domains/dailystocktopick.com/public_html/index.php on line 141
Warning: DOMDocument::loadHTML(): Unexpected end tag : a in Entity, line: 237 in /home/u552734802/domains/dailystocktopick.com/public_html/index.php on line 141
Warning: DOMDocument::loadHTML(): Unexpected end tag : a in Entity, line: 237 in /home/u552734802/domains/dailystocktopick.com/public_html/index.php on line 141
Warning: DOMDocument::loadHTML(): Unexpected end tag : a in Entity, line: 237 in /home/u552734802/domains/dailystocktopick.com/public_html/index.php on line 141
Warning: DOMDocument::loadHTML(): Unexpected end tag : div in Entity, line: 237 in /home/u552734802/domains/dailystocktopick.com/public_html/index.php on line 141
Warning: DOMDocument::loadHTML(): Unexpected end tag : li in Entity, line: 237 in /home/u552734802/domains/dailystocktopick.com/public_html/index.php on line 141
Warning: DOMDocument::loadHTML(): Unexpected end tag : div in Entity, line: 237 in /home/u552734802/domains/dailystocktopick.com/public_html/index.php on line 141
Warning: DOMDocument::loadHTML(): Unexpected end tag : a in Entity, line: 237 in /home/u552734802/domains/dailystocktopick.com/public_html/index.php on line 141
Warning: DOMDocument::loadHTML(): Unexpected end tag : a in Entity, line: 237 in /home/u552734802/domains/dailystocktopick.com/public_html/index.php on line 141
Warning: DOMDocument::loadHTML(): Unexpected end tag : a in Entity, line: 237 in /home/u552734802/domains/dailystocktopick.com/public_html/index.php on line 141
Warning: DOMDocument::loadHTML(): Unexpected end tag : a in Entity, line: 237 in /home/u552734802/domains/dailystocktopick.com/public_html/index.php on line 141
Warning: DOMDocument::loadHTML(): Unexpected end tag : a in Entity, line: 237 in /home/u552734802/domains/dailystocktopick.com/public_html/index.php on line 141
Warning: DOMDocument::loadHTML(): Unexpected end tag : a in Entity, line: 237 in /home/u552734802/domains/dailystocktopick.com/public_html/index.php on line 141
Warning: DOMDocument::loadHTML(): Unexpected end tag : a in Entity, line: 237 in /home/u552734802/domains/dailystocktopick.com/public_html/index.php on line 141
Warning: DOMDocument::loadHTML(): Unexpected end tag : a in Entity, line: 237 in /home/u552734802/domains/dailystocktopick.com/public_html/index.php on line 141
Warning: DOMDocument::loadHTML(): Unexpected end tag : a in Entity, line: 237 in /home/u552734802/domains/dailystocktopick.com/public_html/index.php on line 141
Warning: DOMDocument::loadHTML(): Unexpected end tag : a in Entity, line: 237 in /home/u552734802/domains/dailystocktopick.com/public_html/index.php on line 141
Warning: DOMDocument::loadHTML(): Unexpected end tag : a in Entity, line: 237 in /home/u552734802/domains/dailystocktopick.com/public_html/index.php on line 141
Warning: DOMDocument::loadHTML(): Unexpected end tag : a in Entity, line: 237 in /home/u552734802/domains/dailystocktopick.com/public_html/index.php on line 141
Warning: DOMDocument::loadHTML(): Unexpected end tag : a in Entity, line: 237 in /home/u552734802/domains/dailystocktopick.com/public_html/index.php on line 141
Warning: DOMDocument::loadHTML(): Unexpected end tag : div in Entity, line: 237 in /home/u552734802/domains/dailystocktopick.com/public_html/index.php on line 141
Warning: DOMDocument::loadHTML(): Unexpected end tag : li in Entity, line: 237 in /home/u552734802/domains/dailystocktopick.com/public_html/index.php on line 141
Warning: DOMDocument::loadHTML(): Unexpected end tag : ul in Entity, line: 237 in /home/u552734802/domains/dailystocktopick.com/public_html/index.php on line 141
Warning: DOMDocument::loadHTML(): Unexpected end tag : h2 in Entity, line: 252 in /home/u552734802/domains/dailystocktopick.com/public_html/index.php on line 141
Warning: DOMDocument::loadHTML(): Unexpected end tag : p in Entity, line: 253 in /home/u552734802/domains/dailystocktopick.com/public_html/index.php on line 141
Warning: DOMDocument::loadHTML(): Unexpected end tag : button in Entity, line: 256 in /home/u552734802/domains/dailystocktopick.com/public_html/index.php on line 141
Warning: DOMDocument::loadHTML(): Unexpected end tag : div in Entity, line: 257 in /home/u552734802/domains/dailystocktopick.com/public_html/index.php on line 141
Warning: DOMDocument::loadHTML(): Unexpected end tag : i in Entity, line: 237 in /home/u552734802/domains/dailystocktopick.com/public_html/index.php on line 141
Warning: DOMDocument::loadHTML(): Unexpected end tag : span in Entity, line: 237 in /home/u552734802/domains/dailystocktopick.com/public_html/index.php on line 141
Warning: DOMDocument::loadHTML(): Unexpected end tag : div in Entity, line: 237 in /home/u552734802/domains/dailystocktopick.com/public_html/index.php on line 141
Warning: DOMDocument::loadHTML(): Unexpected end tag : div in Entity, line: 237 in /home/u552734802/domains/dailystocktopick.com/public_html/index.php on line 141
Warning: DOMDocument::loadHTML(): Unexpected end tag : a in Entity, line: 237 in /home/u552734802/domains/dailystocktopick.com/public_html/index.php on line 141
Warning: DOMDocument::loadHTML(): Unexpected end tag : a in Entity, line: 237 in /home/u552734802/domains/dailystocktopick.com/public_html/index.php on line 141
Warning: DOMDocument::loadHTML(): Unexpected end tag : a in Entity, line: 237 in /home/u552734802/domains/dailystocktopick.com/public_html/index.php on line 141
Warning: DOMDocument::loadHTML(): Unexpected end tag : a in Entity, line: 237 in /home/u552734802/domains/dailystocktopick.com/public_html/index.php on line 141
Warning: DOMDocument::loadHTML(): Unexpected end tag : a in Entity, line: 237 in /home/u552734802/domains/dailystocktopick.com/public_html/index.php on line 141
Warning: DOMDocument::loadHTML(): Unexpected end tag : a in Entity, line: 237 in /home/u552734802/domains/dailystocktopick.com/public_html/index.php on line 141
Warning: DOMDocument::loadHTML(): Unexpected end tag : a in Entity, line: 237 in /home/u552734802/domains/dailystocktopick.com/public_html/index.php on line 141
Warning: DOMDocument::loadHTML(): Unexpected end tag : a in Entity, line: 237 in /home/u552734802/domains/dailystocktopick.com/public_html/index.php on line 141
Warning: DOMDocument::loadHTML(): Unexpected end tag : a in Entity, line: 237 in /home/u552734802/domains/dailystocktopick.com/public_html/index.php on line 141
Warning: DOMDocument::loadHTML(): Unexpected end tag : a in Entity, line: 237 in /home/u552734802/domains/dailystocktopick.com/public_html/index.php on line 141
Warning: DOMDocument::loadHTML(): Unexpected end tag : a in Entity, line: 237 in /home/u552734802/domains/dailystocktopick.com/public_html/index.php on line 141
Warning: DOMDocument::loadHTML(): Unexpected end tag : div in Entity, line: 237 in /home/u552734802/domains/dailystocktopick.com/public_html/index.php on line 141
Warning: DOMDocument::loadHTML(): Unexpected end tag : li in Entity, line: 237 in /home/u552734802/domains/dailystocktopick.com/public_html/index.php on line 141
Warning: DOMDocument::loadHTML(): Unexpected end tag : div in Entity, line: 237 in /home/u552734802/domains/dailystocktopick.com/public_html/index.php on line 141
Warning: DOMDocument::loadHTML(): Unexpected end tag : a in Entity, line: 237 in /home/u552734802/domains/dailystocktopick.com/public_html/index.php on line 141
Warning: DOMDocument::loadHTML(): Unexpected end tag : a in Entity, line: 237 in /home/u552734802/domains/dailystocktopick.com/public_html/index.php on line 141
Warning: DOMDocument::loadHTML(): Unexpected end tag : a in Entity, line: 237 in /home/u552734802/domains/dailystocktopick.com/public_html/index.php on line 141
Warning: DOMDocument::loadHTML(): Unexpected end tag : a in Entity, line: 237 in /home/u552734802/domains/dailystocktopick.com/public_html/index.php on line 141
Warning: DOMDocument::loadHTML(): Unexpected end tag : a in Entity, line: 237 in /home/u552734802/domains/dailystocktopick.com/public_html/index.php on line 141
Warning: DOMDocument::loadHTML(): Unexpected end tag : a in Entity, line: 237 in /home/u552734802/domains/dailystocktopick.com/public_html/index.php on line 141
Warning: DOMDocument::loadHTML(): Unexpected end tag : a in Entity, line: 237 in /home/u552734802/domains/dailystocktopick.com/public_html/index.php on line 141
Warning: DOMDocument::loadHTML(): Unexpected end tag : a in Entity, line: 237 in /home/u552734802/domains/dailystocktopick.com/public_html/index.php on line 141
Warning: DOMDocument::loadHTML(): Unexpected end tag : a in Entity, line: 237 in /home/u552734802/domains/dailystocktopick.com/public_html/index.php on line 141
Warning: DOMDocument::loadHTML(): Unexpected end tag : a in Entity, line: 237 in /home/u552734802/domains/dailystocktopick.com/public_html/index.php on line 141
Warning: DOMDocument::loadHTML(): Unexpected end tag : a in Entity, line: 237 in /home/u552734802/domains/dailystocktopick.com/public_html/index.php on line 141
Warning: DOMDocument::loadHTML(): Unexpected end tag : a in Entity, line: 237 in /home/u552734802/domains/dailystocktopick.com/public_html/index.php on line 141
Warning: DOMDocument::loadHTML(): Unexpected end tag : div in Entity, line: 237 in /home/u552734802/domains/dailystocktopick.com/public_html/index.php on line 141
Warning: DOMDocument::loadHTML(): Unexpected end tag : li in Entity, line: 237 in /home/u552734802/domains/dailystocktopick.com/public_html/index.php on line 141
Warning: DOMDocument::loadHTML(): Unexpected end tag : div in Entity, line: 237 in /home/u552734802/domains/dailystocktopick.com/public_html/index.php on line 141
Warning: DOMDocument::loadHTML(): Unexpected end tag : a in Entity, line: 237 in /home/u552734802/domains/dailystocktopick.com/public_html/index.php on line 141
Warning: DOMDocument::loadHTML(): Unexpected end tag : a in Entity, line: 237 in /home/u552734802/domains/dailystocktopick.com/public_html/index.php on line 141
Warning: DOMDocument::loadHTML(): Unexpected end tag : a in Entity, line: 237 in /home/u552734802/domains/dailystocktopick.com/public_html/index.php on line 141
Warning: DOMDocument::loadHTML(): Unexpected end tag : a in Entity, line: 237 in /home/u552734802/domains/dailystocktopick.com/public_html/index.php on line 141
Warning: DOMDocument::loadHTML(): Unexpected end tag : a in Entity, line: 237 in /home/u552734802/domains/dailystocktopick.com/public_html/index.php on line 141
Warning: DOMDocument::loadHTML(): Unexpected end tag : a in Entity, line: 237 in /home/u552734802/domains/dailystocktopick.com/public_html/index.php on line 141
Warning: DOMDocument::loadHTML(): Unexpected end tag : a in Entity, line: 237 in /home/u552734802/domains/dailystocktopick.com/public_html/index.php on line 141
Warning: DOMDocument::loadHTML(): Unexpected end tag : a in Entity, line: 237 in /home/u552734802/domains/dailystocktopick.com/public_html/index.php on line 141
Warning: DOMDocument::loadHTML(): Unexpected end tag : div in Entity, line: 237 in /home/u552734802/domains/dailystocktopick.com/public_html/index.php on line 141
Warning: DOMDocument::loadHTML(): Unexpected end tag : li in Entity, line: 237 in /home/u552734802/domains/dailystocktopick.com/public_html/index.php on line 141
Warning: DOMDocument::loadHTML(): Unexpected end tag : div in Entity, line: 237 in /home/u552734802/domains/dailystocktopick.com/public_html/index.php on line 141
Warning: DOMDocument::loadHTML(): Unexpected end tag : a in Entity, line: 237 in /home/u552734802/domains/dailystocktopick.com/public_html/index.php on line 141
Warning: DOMDocument::loadHTML(): Unexpected end tag : a in Entity, line: 237 in /home/u552734802/domains/dailystocktopick.com/public_html/index.php on line 141
Warning: DOMDocument::loadHTML(): Unexpected end tag : a in Entity, line: 237 in /home/u552734802/domains/dailystocktopick.com/public_html/index.php on line 141
Warning: DOMDocument::loadHTML(): Unexpected end tag : a in Entity, line: 237 in /home/u552734802/domains/dailystocktopick.com/public_html/index.php on line 141
Warning: DOMDocument::loadHTML(): Unexpected end tag : a in Entity, line: 237 in /home/u552734802/domains/dailystocktopick.com/public_html/index.php on line 141
Warning: DOMDocument::loadHTML(): Unexpected end tag : a in Entity, line: 237 in /home/u552734802/domains/dailystocktopick.com/public_html/index.php on line 141
Warning: DOMDocument::loadHTML(): Unexpected end tag : a in Entity, line: 237 in /home/u552734802/domains/dailystocktopick.com/public_html/index.php on line 141
Warning: DOMDocument::loadHTML(): Unexpected end tag : a in Entity, line: 237 in /home/u552734802/domains/dailystocktopick.com/public_html/index.php on line 141
Warning: DOMDocument::loadHTML(): Unexpected end tag : a in Entity, line: 237 in /home/u552734802/domains/dailystocktopick.com/public_html/index.php on line 141
Warning: DOMDocument::loadHTML(): Unexpected end tag : a in Entity, line: 237 in /home/u552734802/domains/dailystocktopick.com/public_html/index.php on line 141
Warning: DOMDocument::loadHTML(): Unexpected end tag : a in Entity, line: 237 in /home/u552734802/domains/dailystocktopick.com/public_html/index.php on line 141
Warning: DOMDocument::loadHTML(): Unexpected end tag : a in Entity, line: 237 in /home/u552734802/domains/dailystocktopick.com/public_html/index.php on line 141
Warning: DOMDocument::loadHTML(): Unexpected end tag : div in Entity, line: 237 in /home/u552734802/domains/dailystocktopick.com/public_html/index.php on line 141
Warning: DOMDocument::loadHTML(): Unexpected end tag : li in Entity, line: 237 in /home/u552734802/domains/dailystocktopick.com/public_html/index.php on line 141
Warning: DOMDocument::loadHTML(): Unexpected end tag : div in Entity, line: 237 in /home/u552734802/domains/dailystocktopick.com/public_html/index.php on line 141
Warning: DOMDocument::loadHTML(): Unexpected end tag : a in Entity, line: 237 in /home/u552734802/domains/dailystocktopick.com/public_html/index.php on line 141
Warning: DOMDocument::loadHTML(): Unexpected end tag : a in Entity, line: 237 in /home/u552734802/domains/dailystocktopick.com/public_html/index.php on line 141
Warning: DOMDocument::loadHTML(): Unexpected end tag : a in Entity, line: 237 in /home/u552734802/domains/dailystocktopick.com/public_html/index.php on line 141
Warning: DOMDocument::loadHTML(): Unexpected end tag : a in Entity, line: 237 in /home/u552734802/domains/dailystocktopick.com/public_html/index.php on line 141
Warning: DOMDocument::loadHTML(): Unexpected end tag : a in Entity, line: 237 in /home/u552734802/domains/dailystocktopick.com/public_html/index.php on line 141
Warning: DOMDocument::loadHTML(): Unexpected end tag : a in Entity, line: 237 in /home/u552734802/domains/dailystocktopick.com/public_html/index.php on line 141
Warning: DOMDocument::loadHTML(): Unexpected end tag : div in Entity, line: 237 in /home/u552734802/domains/dailystocktopick.com/public_html/index.php on line 141
Warning: DOMDocument::loadHTML(): Unexpected end tag : li in Entity, line: 237 in /home/u552734802/domains/dailystocktopick.com/public_html/index.php on line 141
Warning: DOMDocument::loadHTML(): Unexpected end tag : div in Entity, line: 237 in /home/u552734802/domains/dailystocktopick.com/public_html/index.php on line 141
Warning: DOMDocument::loadHTML(): Unexpected end tag : a in Entity, line: 237 in /home/u552734802/domains/dailystocktopick.com/public_html/index.php on line 141
Warning: DOMDocument::loadHTML(): Unexpected end tag : a in Entity, line: 237 in /home/u552734802/domains/dailystocktopick.com/public_html/index.php on line 141
Warning: DOMDocument::loadHTML(): Unexpected end tag : a in Entity, line: 237 in /home/u552734802/domains/dailystocktopick.com/public_html/index.php on line 141
Warning: DOMDocument::loadHTML(): Unexpected end tag : a in Entity, line: 237 in /home/u552734802/domains/dailystocktopick.com/public_html/index.php on line 141
Warning: DOMDocument::loadHTML(): Unexpected end tag : a in Entity, line: 237 in /home/u552734802/domains/dailystocktopick.com/public_html/index.php on line 141
Warning: DOMDocument::loadHTML(): Unexpected end tag : a in Entity, line: 237 in /home/u552734802/domains/dailystocktopick.com/public_html/index.php on line 141
Warning: DOMDocument::loadHTML(): Unexpected end tag : a in Entity, line: 237 in /home/u552734802/domains/dailystocktopick.com/public_html/index.php on line 141
Warning: DOMDocument::loadHTML(): Unexpected end tag : a in Entity, line: 237 in /home/u552734802/domains/dailystocktopick.com/public_html/index.php on line 141
Warning: DOMDocument::loadHTML(): Unexpected end tag : a in Entity, line: 237 in /home/u552734802/domains/dailystocktopick.com/public_html/index.php on line 141
Warning: DOMDocument::loadHTML(): Unexpected end tag : a in Entity, line: 237 in /home/u552734802/domains/dailystocktopick.com/public_html/index.php on line 141
Warning: DOMDocument::loadHTML(): Unexpected end tag : a in Entity, line: 237 in /home/u552734802/domains/dailystocktopick.com/public_html/index.php on line 141
Warning: DOMDocument::loadHTML(): Unexpected end tag : a in Entity, line: 237 in /home/u552734802/domains/dailystocktopick.com/public_html/index.php on line 141
Warning: DOMDocument::loadHTML(): Unexpected end tag : a in Entity, line: 237 in /home/u552734802/domains/dailystocktopick.com/public_html/index.php on line 141
Warning: DOMDocument::loadHTML(): Unexpected end tag : a in Entity, line: 237 in /home/u552734802/domains/dailystocktopick.com/public_html/index.php on line 141
Warning: DOMDocument::loadHTML(): Unexpected end tag : a in Entity, line: 237 in /home/u552734802/domains/dailystocktopick.com/public_html/index.php on line 141
Warning: DOMDocument::loadHTML(): Unexpected end tag : a in Entity, line: 237 in /home/u552734802/domains/dailystocktopick.com/public_html/index.php on line 141
Warning: DOMDocument::loadHTML(): Unexpected end tag : a in Entity, line: 237 in /home/u552734802/domains/dailystocktopick.com/public_html/index.php on line 141
Warning: DOMDocument::loadHTML(): Unexpected end tag : a in Entity, line: 237 in /home/u552734802/domains/dailystocktopick.com/public_html/index.php on line 141
Warning: DOMDocument::loadHTML(): Unexpected end tag : div in Entity, line: 237 in /home/u552734802/domains/dailystocktopick.com/public_html/index.php on line 141
Warning: DOMDocument::loadHTML(): Unexpected end tag : li in Entity, line: 237 in /home/u552734802/domains/dailystocktopick.com/public_html/index.php on line 141
Warning: DOMDocument::loadHTML(): Unexpected end tag : div in Entity, line: 237 in /home/u552734802/domains/dailystocktopick.com/public_html/index.php on line 141
Warning: DOMDocument::loadHTML(): Unexpected end tag : a in Entity, line: 237 in /home/u552734802/domains/dailystocktopick.com/public_html/index.php on line 141
Warning: DOMDocument::loadHTML(): Unexpected end tag : a in Entity, line: 237 in /home/u552734802/domains/dailystocktopick.com/public_html/index.php on line 141
Warning: DOMDocument::loadHTML(): Unexpected end tag : a in Entity, line: 237 in /home/u552734802/domains/dailystocktopick.com/public_html/index.php on line 141
Warning: DOMDocument::loadHTML(): Unexpected end tag : a in Entity, line: 237 in /home/u552734802/domains/dailystocktopick.com/public_html/index.php on line 141
Warning: DOMDocument::loadHTML(): Unexpected end tag : a in Entity, line: 237 in /home/u552734802/domains/dailystocktopick.com/public_html/index.php on line 141
Warning: DOMDocument::loadHTML(): Unexpected end tag : a in Entity, line: 237 in /home/u552734802/domains/dailystocktopick.com/public_html/index.php on line 141
Warning: DOMDocument::loadHTML(): Unexpected end tag : a in Entity, line: 237 in /home/u552734802/domains/dailystocktopick.com/public_html/index.php on line 141
Warning: DOMDocument::loadHTML(): Unexpected end tag : a in Entity, line: 237 in /home/u552734802/domains/dailystocktopick.com/public_html/index.php on line 141
Warning: DOMDocument::loadHTML(): Unexpected end tag : a in Entity, line: 237 in /home/u552734802/domains/dailystocktopick.com/public_html/index.php on line 141
Warning: DOMDocument::loadHTML(): Unexpected end tag : a in Entity, line: 237 in /home/u552734802/domains/dailystocktopick.com/public_html/index.php on line 141
Warning: DOMDocument::loadHTML(): Unexpected end tag : a in Entity, line: 237 in /home/u552734802/domains/dailystocktopick.com/public_html/index.php on line 141
Warning: DOMDocument::loadHTML(): Unexpected end tag : a in Entity, line: 237 in /home/u552734802/domains/dailystocktopick.com/public_html/index.php on line 141
Warning: DOMDocument::loadHTML(): Unexpected end tag : a in Entity, line: 237 in /home/u552734802/domains/dailystocktopick.com/public_html/index.php on line 141
Warning: DOMDocument::loadHTML(): Unexpected end tag : a in Entity, line: 237 in /home/u552734802/domains/dailystocktopick.com/public_html/index.php on line 141
Warning: DOMDocument::loadHTML(): Unexpected end tag : a in Entity, line: 237 in /home/u552734802/domains/dailystocktopick.com/public_html/index.php on line 141
Warning: DOMDocument::loadHTML(): Unexpected end tag : div in Entity, line: 237 in /home/u552734802/domains/dailystocktopick.com/public_html/index.php on line 141
Warning: DOMDocument::loadHTML(): Unexpected end tag : li in Entity, line: 237 in /home/u552734802/domains/dailystocktopick.com/public_html/index.php on line 141
Warning: DOMDocument::loadHTML(): Unexpected end tag : div in Entity, line: 237 in /home/u552734802/domains/dailystocktopick.com/public_html/index.php on line 141
Warning: DOMDocument::loadHTML(): Unexpected end tag : a in Entity, line: 237 in /home/u552734802/domains/dailystocktopick.com/public_html/index.php on line 141
Warning: DOMDocument::loadHTML(): Unexpected end tag : a in Entity, line: 237 in /home/u552734802/domains/dailystocktopick.com/public_html/index.php on line 141
Warning: DOMDocument::loadHTML(): Unexpected end tag : a in Entity, line: 237 in /home/u552734802/domains/dailystocktopick.com/public_html/index.php on line 141
Warning: DOMDocument::loadHTML(): Unexpected end tag : a in Entity, line: 237 in /home/u552734802/domains/dailystocktopick.com/public_html/index.php on line 141
Warning: DOMDocument::loadHTML(): Unexpected end tag : a in Entity, line: 237 in /home/u552734802/domains/dailystocktopick.com/public_html/index.php on line 141
Warning: DOMDocument::loadHTML(): Unexpected end tag : a in Entity, line: 237 in /home/u552734802/domains/dailystocktopick.com/public_html/index.php on line 141
Warning: DOMDocument::loadHTML(): Unexpected end tag : a in Entity, line: 237 in /home/u552734802/domains/dailystocktopick.com/public_html/index.php on line 141
Warning: DOMDocument::loadHTML(): Unexpected end tag : a in Entity, line: 237 in /home/u552734802/domains/dailystocktopick.com/public_html/index.php on line 141
Warning: DOMDocument::loadHTML(): Unexpected end tag : a in Entity, line: 237 in /home/u552734802/domains/dailystocktopick.com/public_html/index.php on line 141
Warning: DOMDocument::loadHTML(): Unexpected end tag : a in Entity, line: 237 in /home/u552734802/domains/dailystocktopick.com/public_html/index.php on line 141
Warning: DOMDocument::loadHTML(): Unexpected end tag : a in Entity, line: 237 in /home/u552734802/domains/dailystocktopick.com/public_html/index.php on line 141
Warning: DOMDocument::loadHTML(): Unexpected end tag : a in Entity, line: 237 in /home/u552734802/domains/dailystocktopick.com/public_html/index.php on line 141
Warning: DOMDocument::loadHTML(): Unexpected end tag : a in Entity, line: 237 in /home/u552734802/domains/dailystocktopick.com/public_html/index.php on line 141
Warning: DOMDocument::loadHTML(): Unexpected end tag : div in Entity, line: 237 in /home/u552734802/domains/dailystocktopick.com/public_html/index.php on line 141
Warning: DOMDocument::loadHTML(): Unexpected end tag : li in Entity, line: 237 in /home/u552734802/domains/dailystocktopick.com/public_html/index.php on line 141
Warning: DOMDocument::loadHTML(): Unexpected end tag : div in Entity, line: 237 in /home/u552734802/domains/dailystocktopick.com/public_html/index.php on line 141
Warning: DOMDocument::loadHTML(): Unexpected end tag : a in Entity, line: 237 in /home/u552734802/domains/dailystocktopick.com/public_html/index.php on line 141
Warning: DOMDocument::loadHTML(): Unexpected end tag : a in Entity, line: 237 in /home/u552734802/domains/dailystocktopick.com/public_html/index.php on line 141
Warning: DOMDocument::loadHTML(): Unexpected end tag : a in Entity, line: 237 in /home/u552734802/domains/dailystocktopick.com/public_html/index.php on line 141
Warning: DOMDocument::loadHTML(): Unexpected end tag : a in Entity, line: 237 in /home/u552734802/domains/dailystocktopick.com/public_html/index.php on line 141
Warning: DOMDocument::loadHTML(): Unexpected end tag : a in Entity, line: 237 in /home/u552734802/domains/dailystocktopick.com/public_html/index.php on line 141
Warning: DOMDocument::loadHTML(): Unexpected end tag : a in Entity, line: 237 in /home/u552734802/domains/dailystocktopick.com/public_html/index.php on line 141
Warning: DOMDocument::loadHTML(): Unexpected end tag : a in Entity, line: 237 in /home/u552734802/domains/dailystocktopick.com/public_html/index.php on line 141
Warning: DOMDocument::loadHTML(): Unexpected end tag : a in Entity, line: 237 in /home/u552734802/domains/dailystocktopick.com/public_html/index.php on line 141
Warning: DOMDocument::loadHTML(): Unexpected end tag : a in Entity, line: 237 in /home/u552734802/domains/dailystocktopick.com/public_html/index.php on line 141
Warning: DOMDocument::loadHTML(): Unexpected end tag : a in Entity, line: 237 in /home/u552734802/domains/dailystocktopick.com/public_html/index.php on line 141
Warning: DOMDocument::loadHTML(): Unexpected end tag : a in Entity, line: 237 in /home/u552734802/domains/dailystocktopick.com/public_html/index.php on line 141
Warning: DOMDocument::loadHTML(): Unexpected end tag : a in Entity, line: 237 in /home/u552734802/domains/dailystocktopick.com/public_html/index.php on line 141
Warning: DOMDocument::loadHTML(): Unexpected end tag : a in Entity, line: 237 in /home/u552734802/domains/dailystocktopick.com/public_html/index.php on line 141
Warning: DOMDocument::loadHTML(): Unexpected end tag : a in Entity, line: 237 in /home/u552734802/domains/dailystocktopick.com/public_html/index.php on line 141
Warning: DOMDocument::loadHTML(): Unexpected end tag : a in Entity, line: 237 in /home/u552734802/domains/dailystocktopick.com/public_html/index.php on line 141
Warning: DOMDocument::loadHTML(): Unexpected end tag : a in Entity, line: 237 in /home/u552734802/domains/dailystocktopick.com/public_html/index.php on line 141
Warning: DOMDocument::loadHTML(): Unexpected end tag : div in Entity, line: 237 in /home/u552734802/domains/dailystocktopick.com/public_html/index.php on line 141
Warning: DOMDocument::loadHTML(): Unexpected end tag : li in Entity, line: 237 in /home/u552734802/domains/dailystocktopick.com/public_html/index.php on line 141
Warning: DOMDocument::loadHTML(): Unexpected end tag : div in Entity, line: 237 in /home/u552734802/domains/dailystocktopick.com/public_html/index.php on line 141
Warning: DOMDocument::loadHTML(): Unexpected end tag : a in Entity, line: 237 in /home/u552734802/domains/dailystocktopick.com/public_html/index.php on line 141
Warning: DOMDocument::loadHTML(): Unexpected end tag : a in Entity, line: 237 in /home/u552734802/domains/dailystocktopick.com/public_html/index.php on line 141
Warning: DOMDocument::loadHTML(): Unexpected end tag : a in Entity, line: 237 in /home/u552734802/domains/dailystocktopick.com/public_html/index.php on line 141
Warning: DOMDocument::loadHTML(): Unexpected end tag : a in Entity, line: 237 in /home/u552734802/domains/dailystocktopick.com/public_html/index.php on line 141
Warning: DOMDocument::loadHTML(): Unexpected end tag : a in Entity, line: 237 in /home/u552734802/domains/dailystocktopick.com/public_html/index.php on line 141
Warning: DOMDocument::loadHTML(): Unexpected end tag : a in Entity, line: 237 in /home/u552734802/domains/dailystocktopick.com/public_html/index.php on line 141
Warning: DOMDocument::loadHTML(): Unexpected end tag : a in Entity, line: 237 in /home/u552734802/domains/dailystocktopick.com/public_html/index.php on line 141
Warning: DOMDocument::loadHTML(): Unexpected end tag : a in Entity, line: 237 in /home/u552734802/domains/dailystocktopick.com/public_html/index.php on line 141
Warning: DOMDocument::loadHTML(): Unexpected end tag : a in Entity, line: 237 in /home/u552734802/domains/dailystocktopick.com/public_html/index.php on line 141
Warning: DOMDocument::loadHTML(): Unexpected end tag : a in Entity, line: 237 in /home/u552734802/domains/dailystocktopick.com/public_html/index.php on line 141
Warning: DOMDocument::loadHTML(): Unexpected end tag : a in Entity, line: 237 in /home/u552734802/domains/dailystocktopick.com/public_html/index.php on line 141
Warning: DOMDocument::loadHTML(): Unexpected end tag : a in Entity, line: 237 in /home/u552734802/domains/dailystocktopick.com/public_html/index.php on line 141
Warning: DOMDocument::loadHTML(): Unexpected end tag : a in Entity, line: 237 in /home/u552734802/domains/dailystocktopick.com/public_html/index.php on line 141
Warning: DOMDocument::loadHTML(): Unexpected end tag : a in Entity, line: 237 in /home/u552734802/domains/dailystocktopick.com/public_html/index.php on line 141
Warning: DOMDocument::loadHTML(): Unexpected end tag : a in Entity, line: 237 in /home/u552734802/domains/dailystocktopick.com/public_html/index.php on line 141
Warning: DOMDocument::loadHTML(): Unexpected end tag : a in Entity, line: 237 in /home/u552734802/domains/dailystocktopick.com/public_html/index.php on line 141
Warning: DOMDocument::loadHTML(): Unexpected end tag : div in Entity, line: 237 in /home/u552734802/domains/dailystocktopick.com/public_html/index.php on line 141
Warning: DOMDocument::loadHTML(): Unexpected end tag : li in Entity, line: 237 in /home/u552734802/domains/dailystocktopick.com/public_html/index.php on line 141
Warning: DOMDocument::loadHTML(): Unexpected end tag : div in Entity, line: 237 in /home/u552734802/domains/dailystocktopick.com/public_html/index.php on line 141
Warning: DOMDocument::loadHTML(): Unexpected end tag : a in Entity, line: 237 in /home/u552734802/domains/dailystocktopick.com/public_html/index.php on line 141
Warning: DOMDocument::loadHTML(): Unexpected end tag : a in Entity, line: 237 in /home/u552734802/domains/dailystocktopick.com/public_html/index.php on line 141
Warning: DOMDocument::loadHTML(): Unexpected end tag : a in Entity, line: 237 in /home/u552734802/domains/dailystocktopick.com/public_html/index.php on line 141
Warning: DOMDocument::loadHTML(): Unexpected end tag : a in Entity, line: 237 in /home/u552734802/domains/dailystocktopick.com/public_html/index.php on line 141
Warning: DOMDocument::loadHTML(): Unexpected end tag : a in Entity, line: 237 in /home/u552734802/domains/dailystocktopick.com/public_html/index.php on line 141
Warning: DOMDocument::loadHTML(): Unexpected end tag : a in Entity, line: 237 in /home/u552734802/domains/dailystocktopick.com/public_html/index.php on line 141
Warning: DOMDocument::loadHTML(): Unexpected end tag : a in Entity, line: 237 in /home/u552734802/domains/dailystocktopick.com/public_html/index.php on line 141
Warning: DOMDocument::loadHTML(): Unexpected end tag : a in Entity, line: 237 in /home/u552734802/domains/dailystocktopick.com/public_html/index.php on line 141
Warning: DOMDocument::loadHTML(): Unexpected end tag : a in Entity, line: 237 in /home/u552734802/domains/dailystocktopick.com/public_html/index.php on line 141
Warning: DOMDocument::loadHTML(): Unexpected end tag : a in Entity, line: 237 in /home/u552734802/domains/dailystocktopick.com/public_html/index.php on line 141
Warning: DOMDocument::loadHTML(): Unexpected end tag : a in Entity, line: 237 in /home/u552734802/domains/dailystocktopick.com/public_html/index.php on line 141
Warning: DOMDocument::loadHTML(): Unexpected end tag : a in Entity, line: 237 in /home/u552734802/domains/dailystocktopick.com/public_html/index.php on line 141
Warning: DOMDocument::loadHTML(): Unexpected end tag : a in Entity, line: 237 in /home/u552734802/domains/dailystocktopick.com/public_html/index.php on line 141
Warning: DOMDocument::loadHTML(): Unexpected end tag : a in Entity, line: 237 in /home/u552734802/domains/dailystocktopick.com/public_html/index.php on line 141
Warning: DOMDocument::loadHTML(): Unexpected end tag : a in Entity, line: 237 in /home/u552734802/domains/dailystocktopick.com/public_html/index.php on line 141
Warning: DOMDocument::loadHTML(): Unexpected end tag : a in Entity, line: 237 in /home/u552734802/domains/dailystocktopick.com/public_html/index.php on line 141
Warning: DOMDocument::loadHTML(): Unexpected end tag : a in Entity, line: 237 in /home/u552734802/domains/dailystocktopick.com/public_html/index.php on line 141
Warning: DOMDocument::loadHTML(): Unexpected end tag : a in Entity, line: 237 in /home/u552734802/domains/dailystocktopick.com/public_html/index.php on line 141
Warning: DOMDocument::loadHTML(): Unexpected end tag : div in Entity, line: 237 in /home/u552734802/domains/dailystocktopick.com/public_html/index.php on line 141
Warning: DOMDocument::loadHTML(): Unexpected end tag : li in Entity, line: 237 in /home/u552734802/domains/dailystocktopick.com/public_html/index.php on line 141
Warning: DOMDocument::loadHTML(): Unexpected end tag : div in Entity, line: 237 in /home/u552734802/domains/dailystocktopick.com/public_html/index.php on line 141
Warning: DOMDocument::loadHTML(): Unexpected end tag : a in Entity, line: 237 in /home/u552734802/domains/dailystocktopick.com/public_html/index.php on line 141
Warning: DOMDocument::loadHTML(): Unexpected end tag : a in Entity, line: 237 in /home/u552734802/domains/dailystocktopick.com/public_html/index.php on line 141
Warning: DOMDocument::loadHTML(): Unexpected end tag : a in Entity, line: 237 in /home/u552734802/domains/dailystocktopick.com/public_html/index.php on line 141
Warning: DOMDocument::loadHTML(): Unexpected end tag : a in Entity, line: 237 in /home/u552734802/domains/dailystocktopick.com/public_html/index.php on line 141
Warning: DOMDocument::loadHTML(): Unexpected end tag : a in Entity, line: 237 in /home/u552734802/domains/dailystocktopick.com/public_html/index.php on line 141
Warning: DOMDocument::loadHTML(): Unexpected end tag : a in Entity, line: 237 in /home/u552734802/domains/dailystocktopick.com/public_html/index.php on line 141
Warning: DOMDocument::loadHTML(): Unexpected end tag : a in Entity, line: 237 in /home/u552734802/domains/dailystocktopick.com/public_html/index.php on line 141
Warning: DOMDocument::loadHTML(): Unexpected end tag : a in Entity, line: 237 in /home/u552734802/domains/dailystocktopick.com/public_html/index.php on line 141
Warning: DOMDocument::loadHTML(): Unexpected end tag : a in Entity, line: 237 in /home/u552734802/domains/dailystocktopick.com/public_html/index.php on line 141
Warning: DOMDocument::loadHTML(): Unexpected end tag : a in Entity, line: 237 in /home/u552734802/domains/dailystocktopick.com/public_html/index.php on line 141
Warning: DOMDocument::loadHTML(): Unexpected end tag : div in Entity, line: 237 in /home/u552734802/domains/dailystocktopick.com/public_html/index.php on line 141
Warning: DOMDocument::loadHTML(): Unexpected end tag : li in Entity, line: 237 in /home/u552734802/domains/dailystocktopick.com/public_html/index.php on line 141
Warning: DOMDocument::loadHTML(): Unexpected end tag : div in Entity, line: 237 in /home/u552734802/domains/dailystocktopick.com/public_html/index.php on line 141
Warning: DOMDocument::loadHTML(): Unexpected end tag : a in Entity, line: 237 in /home/u552734802/domains/dailystocktopick.com/public_html/index.php on line 141
Warning: DOMDocument::loadHTML(): Unexpected end tag : a in Entity, line: 237 in /home/u552734802/domains/dailystocktopick.com/public_html/index.php on line 141
Warning: DOMDocument::loadHTML(): Unexpected end tag : a in Entity, line: 237 in /home/u552734802/domains/dailystocktopick.com/public_html/index.php on line 141
Warning: DOMDocument::loadHTML(): Unexpected end tag : a in Entity, line: 237 in /home/u552734802/domains/dailystocktopick.com/public_html/index.php on line 141
Warning: DOMDocument::loadHTML(): Unexpected end tag : a in Entity, line: 237 in /home/u552734802/domains/dailystocktopick.com/public_html/index.php on line 141
Warning: DOMDocument::loadHTML(): Unexpected end tag : a in Entity, line: 237 in /home/u552734802/domains/dailystocktopick.com/public_html/index.php on line 141
Warning: DOMDocument::loadHTML(): Unexpected end tag : a in Entity, line: 237 in /home/u552734802/domains/dailystocktopick.com/public_html/index.php on line 141
Warning: DOMDocument::loadHTML(): Unexpected end tag : a in Entity, line: 237 in /home/u552734802/domains/dailystocktopick.com/public_html/index.php on line 141
Warning: DOMDocument::loadHTML(): Unexpected end tag : a in Entity, line: 237 in /home/u552734802/domains/dailystocktopick.com/public_html/index.php on line 141
Warning: DOMDocument::loadHTML(): Unexpected end tag : a in Entity, line: 237 in /home/u552734802/domains/dailystocktopick.com/public_html/index.php on line 141
Warning: DOMDocument::loadHTML(): Unexpected end tag : div in Entity, line: 237 in /home/u552734802/domains/dailystocktopick.com/public_html/index.php on line 141
Warning: DOMDocument::loadHTML(): Unexpected end tag : li in Entity, line: 237 in /home/u552734802/domains/dailystocktopick.com/public_html/index.php on line 141
Warning: DOMDocument::loadHTML(): Unexpected end tag : div in Entity, line: 237 in /home/u552734802/domains/dailystocktopick.com/public_html/index.php on line 141
Warning: DOMDocument::loadHTML(): Unexpected end tag : a in Entity, line: 237 in /home/u552734802/domains/dailystocktopick.com/public_html/index.php on line 141
Warning: DOMDocument::loadHTML(): Unexpected end tag : a in Entity, line: 237 in /home/u552734802/domains/dailystocktopick.com/public_html/index.php on line 141
Warning: DOMDocument::loadHTML(): Unexpected end tag : a in Entity, line: 237 in /home/u552734802/domains/dailystocktopick.com/public_html/index.php on line 141
Warning: DOMDocument::loadHTML(): Unexpected end tag : a in Entity, line: 237 in /home/u552734802/domains/dailystocktopick.com/public_html/index.php on line 141
Warning: DOMDocument::loadHTML(): Unexpected end tag : a in Entity, line: 237 in /home/u552734802/domains/dailystocktopick.com/public_html/index.php on line 141
Warning: DOMDocument::loadHTML(): Unexpected end tag : a in Entity, line: 237 in /home/u552734802/domains/dailystocktopick.com/public_html/index.php on line 141
Warning: DOMDocument::loadHTML(): Unexpected end tag : a in Entity, line: 237 in /home/u552734802/domains/dailystocktopick.com/public_html/index.php on line 141
Warning: DOMDocument::loadHTML(): Unexpected end tag : a in Entity, line: 237 in /home/u552734802/domains/dailystocktopick.com/public_html/index.php on line 141
Warning: DOMDocument::loadHTML(): Unexpected end tag : a in Entity, line: 237 in /home/u552734802/domains/dailystocktopick.com/public_html/index.php on line 141
Warning: DOMDocument::loadHTML(): Unexpected end tag : a in Entity, line: 237 in /home/u552734802/domains/dailystocktopick.com/public_html/index.php on line 141
Warning: DOMDocument::loadHTML(): Unexpected end tag : a in Entity, line: 237 in /home/u552734802/domains/dailystocktopick.com/public_html/index.php on line 141
Warning: DOMDocument::loadHTML(): Unexpected end tag : div in Entity, line: 237 in /home/u552734802/domains/dailystocktopick.com/public_html/index.php on line 141
Warning: DOMDocument::loadHTML(): Unexpected end tag : li in Entity, line: 237 in /home/u552734802/domains/dailystocktopick.com/public_html/index.php on line 141
Warning: DOMDocument::loadHTML(): Unexpected end tag : div in Entity, line: 237 in /home/u552734802/domains/dailystocktopick.com/public_html/index.php on line 141
Warning: DOMDocument::loadHTML(): Unexpected end tag : a in Entity, line: 237 in /home/u552734802/domains/dailystocktopick.com/public_html/index.php on line 141
Warning: DOMDocument::loadHTML(): Unexpected end tag : a in Entity, line: 237 in /home/u552734802/domains/dailystocktopick.com/public_html/index.php on line 141
Warning: DOMDocument::loadHTML(): Unexpected end tag : a in Entity, line: 237 in /home/u552734802/domains/dailystocktopick.com/public_html/index.php on line 141
Warning: DOMDocument::loadHTML(): Unexpected end tag : a in Entity, line: 237 in /home/u552734802/domains/dailystocktopick.com/public_html/index.php on line 141
Warning: DOMDocument::loadHTML(): Unexpected end tag : a in Entity, line: 237 in /home/u552734802/domains/dailystocktopick.com/public_html/index.php on line 141
Warning: DOMDocument::loadHTML(): Unexpected end tag : a in Entity, line: 237 in /home/u552734802/domains/dailystocktopick.com/public_html/index.php on line 141
Warning: DOMDocument::loadHTML(): Unexpected end tag : a in Entity, line: 237 in /home/u552734802/domains/dailystocktopick.com/public_html/index.php on line 141
Warning: DOMDocument::loadHTML(): Unexpected end tag : a in Entity, line: 237 in /home/u552734802/domains/dailystocktopick.com/public_html/index.php on line 141
Warning: DOMDocument::loadHTML(): Unexpected end tag : a in Entity, line: 237 in /home/u552734802/domains/dailystocktopick.com/public_html/index.php on line 141
Warning: DOMDocument::loadHTML(): Unexpected end tag : a in Entity, line: 237 in /home/u552734802/domains/dailystocktopick.com/public_html/index.php on line 141
Warning: DOMDocument::loadHTML(): Unexpected end tag : a in Entity, line: 237 in /home/u552734802/domains/dailystocktopick.com/public_html/index.php on line 141
Warning: DOMDocument::loadHTML(): Unexpected end tag : a in Entity, line: 237 in /home/u552734802/domains/dailystocktopick.com/public_html/index.php on line 141
Warning: DOMDocument::loadHTML(): Unexpected end tag : a in Entity, line: 237 in /home/u552734802/domains/dailystocktopick.com/public_html/index.php on line 141
Warning: DOMDocument::loadHTML(): Unexpected end tag : a in Entity, line: 237 in /home/u552734802/domains/dailystocktopick.com/public_html/index.php on line 141
Warning: DOMDocument::loadHTML(): Unexpected end tag : a in Entity, line: 237 in /home/u552734802/domains/dailystocktopick.com/public_html/index.php on line 141
Warning: DOMDocument::loadHTML(): Unexpected end tag : a in Entity, line: 237 in /home/u552734802/domains/dailystocktopick.com/public_html/index.php on line 141
Warning: DOMDocument::loadHTML(): Unexpected end tag : a in Entity, line: 237 in /home/u552734802/domains/dailystocktopick.com/public_html/index.php on line 141
Warning: DOMDocument::loadHTML(): Unexpected end tag : div in Entity, line: 237 in /home/u552734802/domains/dailystocktopick.com/public_html/index.php on line 141
Warning: DOMDocument::loadHTML(): Unexpected end tag : li in Entity, line: 237 in /home/u552734802/domains/dailystocktopick.com/public_html/index.php on line 141
Warning: DOMDocument::loadHTML(): Unexpected end tag : div in Entity, line: 237 in /home/u552734802/domains/dailystocktopick.com/public_html/index.php on line 141
Warning: DOMDocument::loadHTML(): Unexpected end tag : a in Entity, line: 237 in /home/u552734802/domains/dailystocktopick.com/public_html/index.php on line 141
Warning: DOMDocument::loadHTML(): Unexpected end tag : a in Entity, line: 237 in /home/u552734802/domains/dailystocktopick.com/public_html/index.php on line 141
Warning: DOMDocument::loadHTML(): Unexpected end tag : a in Entity, line: 237 in /home/u552734802/domains/dailystocktopick.com/public_html/index.php on line 141
Warning: DOMDocument::loadHTML(): Unexpected end tag : a in Entity, line: 237 in /home/u552734802/domains/dailystocktopick.com/public_html/index.php on line 141
Warning: DOMDocument::loadHTML(): Unexpected end tag : a in Entity, line: 237 in /home/u552734802/domains/dailystocktopick.com/public_html/index.php on line 141
Warning: DOMDocument::loadHTML(): Unexpected end tag : a in Entity, line: 237 in /home/u552734802/domains/dailystocktopick.com/public_html/index.php on line 141
Warning: DOMDocument::loadHTML(): Unexpected end tag : a in Entity, line: 237 in /home/u552734802/domains/dailystocktopick.com/public_html/index.php on line 141
Warning: DOMDocument::loadHTML(): Unexpected end tag : a in Entity, line: 237 in /home/u552734802/domains/dailystocktopick.com/public_html/index.php on line 141
Warning: DOMDocument::loadHTML(): Unexpected end tag : a in Entity, line: 237 in /home/u552734802/domains/dailystocktopick.com/public_html/index.php on line 141
Warning: DOMDocument::loadHTML(): Unexpected end tag : a in Entity, line: 237 in /home/u552734802/domains/dailystocktopick.com/public_html/index.php on line 141
Warning: DOMDocument::loadHTML(): Unexpected end tag : a in Entity, line: 237 in /home/u552734802/domains/dailystocktopick.com/public_html/index.php on line 141
Warning: DOMDocument::loadHTML(): Unexpected end tag : a in Entity, line: 237 in /home/u552734802/domains/dailystocktopick.com/public_html/index.php on line 141
Warning: DOMDocument::loadHTML(): Unexpected end tag : a in Entity, line: 237 in /home/u552734802/domains/dailystocktopick.com/public_html/index.php on line 141
Warning: DOMDocument::loadHTML(): Unexpected end tag : div in Entity, line: 237 in /home/u552734802/domains/dailystocktopick.com/public_html/index.php on line 141
Warning: DOMDocument::loadHTML(): Unexpected end tag : li in Entity, line: 237 in /home/u552734802/domains/dailystocktopick.com/public_html/index.php on line 141
Warning: DOMDocument::loadHTML(): Unexpected end tag : div in Entity, line: 237 in /home/u552734802/domains/dailystocktopick.com/public_html/index.php on line 141
Warning: DOMDocument::loadHTML(): Unexpected end tag : a in Entity, line: 237 in /home/u552734802/domains/dailystocktopick.com/public_html/index.php on line 141
Warning: DOMDocument::loadHTML(): Unexpected end tag : a in Entity, line: 237 in /home/u552734802/domains/dailystocktopick.com/public_html/index.php on line 141
Warning: DOMDocument::loadHTML(): Unexpected end tag : a in Entity, line: 237 in /home/u552734802/domains/dailystocktopick.com/public_html/index.php on line 141
Warning: DOMDocument::loadHTML(): Unexpected end tag : a in Entity, line: 237 in /home/u552734802/domains/dailystocktopick.com/public_html/index.php on line 141
Warning: DOMDocument::loadHTML(): Unexpected end tag : a in Entity, line: 237 in /home/u552734802/domains/dailystocktopick.com/public_html/index.php on line 141
Warning: DOMDocument::loadHTML(): Unexpected end tag : a in Entity, line: 237 in /home/u552734802/domains/dailystocktopick.com/public_html/index.php on line 141
Warning: DOMDocument::loadHTML(): Unexpected end tag : a in Entity, line: 237 in /home/u552734802/domains/dailystocktopick.com/public_html/index.php on line 141
Warning: DOMDocument::loadHTML(): Unexpected end tag : a in Entity, line: 237 in /home/u552734802/domains/dailystocktopick.com/public_html/index.php on line 141
Warning: DOMDocument::loadHTML(): Unexpected end tag : a in Entity, line: 237 in /home/u552734802/domains/dailystocktopick.com/public_html/index.php on line 141
Warning: DOMDocument::loadHTML(): Unexpected end tag : a in Entity, line: 237 in /home/u552734802/domains/dailystocktopick.com/public_html/index.php on line 141
Warning: DOMDocument::loadHTML(): Unexpected end tag : a in Entity, line: 237 in /home/u552734802/domains/dailystocktopick.com/public_html/index.php on line 141
Warning: DOMDocument::loadHTML(): Unexpected end tag : a in Entity, line: 237 in /home/u552734802/domains/dailystocktopick.com/public_html/index.php on line 141
Warning: DOMDocument::loadHTML(): Unexpected end tag : a in Entity, line: 237 in /home/u552734802/domains/dailystocktopick.com/public_html/index.php on line 141
Warning: DOMDocument::loadHTML(): Unexpected end tag : a in Entity, line: 237 in /home/u552734802/domains/dailystocktopick.com/public_html/index.php on line 141
Warning: DOMDocument::loadHTML(): Unexpected end tag : a in Entity, line: 237 in /home/u552734802/domains/dailystocktopick.com/public_html/index.php on line 141
Warning: DOMDocument::loadHTML(): Unexpected end tag : div in Entity, line: 237 in /home/u552734802/domains/dailystocktopick.com/public_html/index.php on line 141
Warning: DOMDocument::loadHTML(): Unexpected end tag : li in Entity, line: 237 in /home/u552734802/domains/dailystocktopick.com/public_html/index.php on line 141
Warning: DOMDocument::loadHTML(): Unexpected end tag : div in Entity, line: 237 in /home/u552734802/domains/dailystocktopick.com/public_html/index.php on line 141
Warning: DOMDocument::loadHTML(): Unexpected end tag : a in Entity, line: 237 in /home/u552734802/domains/dailystocktopick.com/public_html/index.php on line 141
Warning: DOMDocument::loadHTML(): Unexpected end tag : a in Entity, line: 237 in /home/u552734802/domains/dailystocktopick.com/public_html/index.php on line 141
Warning: DOMDocument::loadHTML(): Unexpected end tag : a in Entity, line: 237 in /home/u552734802/domains/dailystocktopick.com/public_html/index.php on line 141
Warning: DOMDocument::loadHTML(): Unexpected end tag : a in Entity, line: 237 in /home/u552734802/domains/dailystocktopick.com/public_html/index.php on line 141
Warning: DOMDocument::loadHTML(): Unexpected end tag : a in Entity, line: 237 in /home/u552734802/domains/dailystocktopick.com/public_html/index.php on line 141
Warning: DOMDocument::loadHTML(): Unexpected end tag : a in Entity, line: 237 in /home/u552734802/domains/dailystocktopick.com/public_html/index.php on line 141
Warning: DOMDocument::loadHTML(): Unexpected end tag : a in Entity, line: 237 in /home/u552734802/domains/dailystocktopick.com/public_html/index.php on line 141
Warning: DOMDocument::loadHTML(): Unexpected end tag : a in Entity, line: 237 in /home/u552734802/domains/dailystocktopick.com/public_html/index.php on line 141
Warning: DOMDocument::loadHTML(): Unexpected end tag : a in Entity, line: 237 in /home/u552734802/domains/dailystocktopick.com/public_html/index.php on line 141
Warning: DOMDocument::loadHTML(): Unexpected end tag : a in Entity, line: 237 in /home/u552734802/domains/dailystocktopick.com/public_html/index.php on line 141
Warning: DOMDocument::loadHTML(): Unexpected end tag : div in Entity, line: 237 in /home/u552734802/domains/dailystocktopick.com/public_html/index.php on line 141
Warning: DOMDocument::loadHTML(): Unexpected end tag : li in Entity, line: 237 in /home/u552734802/domains/dailystocktopick.com/public_html/index.php on line 141
Warning: DOMDocument::loadHTML(): Unexpected end tag : div in Entity, line: 237 in /home/u552734802/domains/dailystocktopick.com/public_html/index.php on line 141
Warning: DOMDocument::loadHTML(): Unexpected end tag : a in Entity, line: 237 in /home/u552734802/domains/dailystocktopick.com/public_html/index.php on line 141
Warning: DOMDocument::loadHTML(): Unexpected end tag : a in Entity, line: 237 in /home/u552734802/domains/dailystocktopick.com/public_html/index.php on line 141
Warning: DOMDocument::loadHTML(): Unexpected end tag : a in Entity, line: 237 in /home/u552734802/domains/dailystocktopick.com/public_html/index.php on line 141
Warning: DOMDocument::loadHTML(): Unexpected end tag : a in Entity, line: 237 in /home/u552734802/domains/dailystocktopick.com/public_html/index.php on line 141
Warning: DOMDocument::loadHTML(): Unexpected end tag : a in Entity, line: 237 in /home/u552734802/domains/dailystocktopick.com/public_html/index.php on line 141
Warning: DOMDocument::loadHTML(): Unexpected end tag : a in Entity, line: 237 in /home/u552734802/domains/dailystocktopick.com/public_html/index.php on line 141
Warning: DOMDocument::loadHTML(): Unexpected end tag : a in Entity, line: 237 in /home/u552734802/domains/dailystocktopick.com/public_html/index.php on line 141
Warning: DOMDocument::loadHTML(): Unexpected end tag : a in Entity, line: 237 in /home/u552734802/domains/dailystocktopick.com/public_html/index.php on line 141
Warning: DOMDocument::loadHTML(): Unexpected end tag : a in Entity, line: 237 in /home/u552734802/domains/dailystocktopick.com/public_html/index.php on line 141
Warning: DOMDocument::loadHTML(): Unexpected end tag : a in Entity, line: 237 in /home/u552734802/domains/dailystocktopick.com/public_html/index.php on line 141
Warning: DOMDocument::loadHTML(): Unexpected end tag : a in Entity, line: 237 in /home/u552734802/domains/dailystocktopick.com/public_html/index.php on line 141
Warning: DOMDocument::loadHTML(): Unexpected end tag : a in Entity, line: 237 in /home/u552734802/domains/dailystocktopick.com/public_html/index.php on line 141
Warning: DOMDocument::loadHTML(): Unexpected end tag : a in Entity, line: 237 in /home/u552734802/domains/dailystocktopick.com/public_html/index.php on line 141
Warning: DOMDocument::loadHTML(): Unexpected end tag : a in Entity, line: 237 in /home/u552734802/domains/dailystocktopick.com/public_html/index.php on line 141
Warning: DOMDocument::loadHTML(): Unexpected end tag : a in Entity, line: 237 in /home/u552734802/domains/dailystocktopick.com/public_html/index.php on line 141
Warning: DOMDocument::loadHTML(): Unexpected end tag : a in Entity, line: 237 in /home/u552734802/domains/dailystocktopick.com/public_html/index.php on line 141
Warning: DOMDocument::loadHTML(): Unexpected end tag : a in Entity, line: 237 in /home/u552734802/domains/dailystocktopick.com/public_html/index.php on line 141
Warning: DOMDocument::loadHTML(): Unexpected end tag : a in Entity, line: 237 in /home/u552734802/domains/dailystocktopick.com/public_html/index.php on line 141
Warning: DOMDocument::loadHTML(): Unexpected end tag : a in Entity, line: 237 in /home/u552734802/domains/dailystocktopick.com/public_html/index.php on line 141
Warning: DOMDocument::loadHTML(): Unexpected end tag : div in Entity, line: 237 in /home/u552734802/domains/dailystocktopick.com/public_html/index.php on line 141
Warning: DOMDocument::loadHTML(): Unexpected end tag : li in Entity, line: 237 in /home/u552734802/domains/dailystocktopick.com/public_html/index.php on line 141
Warning: DOMDocument::loadHTML(): Unexpected end tag : div in Entity, line: 237 in /home/u552734802/domains/dailystocktopick.com/public_html/index.php on line 141
Warning: DOMDocument::loadHTML(): Unexpected end tag : a in Entity, line: 237 in /home/u552734802/domains/dailystocktopick.com/public_html/index.php on line 141
Warning: DOMDocument::loadHTML(): Unexpected end tag : a in Entity, line: 237 in /home/u552734802/domains/dailystocktopick.com/public_html/index.php on line 141
Warning: DOMDocument::loadHTML(): Unexpected end tag : a in Entity, line: 237 in /home/u552734802/domains/dailystocktopick.com/public_html/index.php on line 141
Warning: DOMDocument::loadHTML(): Unexpected end tag : a in Entity, line: 237 in /home/u552734802/domains/dailystocktopick.com/public_html/index.php on line 141
Warning: DOMDocument::loadHTML(): Unexpected end tag : a in Entity, line: 237 in /home/u552734802/domains/dailystocktopick.com/public_html/index.php on line 141
Warning: DOMDocument::loadHTML(): Unexpected end tag : a in Entity, line: 237 in /home/u552734802/domains/dailystocktopick.com/public_html/index.php on line 141
Warning: DOMDocument::loadHTML(): Unexpected end tag : a in Entity, line: 237 in /home/u552734802/domains/dailystocktopick.com/public_html/index.php on line 141
Warning: DOMDocument::loadHTML(): Unexpected end tag : a in Entity, line: 237 in /home/u552734802/domains/dailystocktopick.com/public_html/index.php on line 141
Warning: DOMDocument::loadHTML(): Unexpected end tag : a in Entity, line: 237 in /home/u552734802/domains/dailystocktopick.com/public_html/index.php on line 141
Warning: DOMDocument::loadHTML(): Unexpected end tag : a in Entity, line: 237 in /home/u552734802/domains/dailystocktopick.com/public_html/index.php on line 141
Warning: DOMDocument::loadHTML(): Unexpected end tag : a in Entity, line: 237 in /home/u552734802/domains/dailystocktopick.com/public_html/index.php on line 141
Warning: DOMDocument::loadHTML(): Unexpected end tag : a in Entity, line: 237 in /home/u552734802/domains/dailystocktopick.com/public_html/index.php on line 141
Warning: DOMDocument::loadHTML(): Unexpected end tag : a in Entity, line: 237 in /home/u552734802/domains/dailystocktopick.com/public_html/index.php on line 141
Warning: DOMDocument::loadHTML(): Unexpected end tag : div in Entity, line: 237 in /home/u552734802/domains/dailystocktopick.com/public_html/index.php on line 141
Warning: DOMDocument::loadHTML(): Unexpected end tag : li in Entity, line: 237 in /home/u552734802/domains/dailystocktopick.com/public_html/index.php on line 141
Warning: DOMDocument::loadHTML(): Unexpected end tag : div in Entity, line: 237 in /home/u552734802/domains/dailystocktopick.com/public_html/index.php on line 141
Warning: DOMDocument::loadHTML(): Unexpected end tag : a in Entity, line: 237 in /home/u552734802/domains/dailystocktopick.com/public_html/index.php on line 141
Warning: DOMDocument::loadHTML(): Unexpected end tag : a in Entity, line: 237 in /home/u552734802/domains/dailystocktopick.com/public_html/index.php on line 141
Warning: DOMDocument::loadHTML(): Unexpected end tag : a in Entity, line: 237 in /home/u552734802/domains/dailystocktopick.com/public_html/index.php on line 141
Warning: DOMDocument::loadHTML(): Unexpected end tag : a in Entity, line: 237 in /home/u552734802/domains/dailystocktopick.com/public_html/index.php on line 141
Warning: DOMDocument::loadHTML(): Unexpected end tag : a in Entity, line: 237 in /home/u552734802/domains/dailystocktopick.com/public_html/index.php on line 141
Warning: DOMDocument::loadHTML(): Unexpected end tag : a in Entity, line: 237 in /home/u552734802/domains/dailystocktopick.com/public_html/index.php on line 141
Warning: DOMDocument::loadHTML(): Unexpected end tag : a in Entity, line: 237 in /home/u552734802/domains/dailystocktopick.com/public_html/index.php on line 141
Warning: DOMDocument::loadHTML(): Unexpected end tag : a in Entity, line: 237 in /home/u552734802/domains/dailystocktopick.com/public_html/index.php on line 141
Warning: DOMDocument::loadHTML(): Unexpected end tag : div in Entity, line: 237 in /home/u552734802/domains/dailystocktopick.com/public_html/index.php on line 141
Warning: DOMDocument::loadHTML(): Unexpected end tag : li in Entity, line: 237 in /home/u552734802/domains/dailystocktopick.com/public_html/index.php on line 141
Warning: DOMDocument::loadHTML(): Unexpected end tag : div in Entity, line: 237 in /home/u552734802/domains/dailystocktopick.com/public_html/index.php on line 141
Warning: DOMDocument::loadHTML(): Unexpected end tag : a in Entity, line: 237 in /home/u552734802/domains/dailystocktopick.com/public_html/index.php on line 141
Warning: DOMDocument::loadHTML(): Unexpected end tag : a in Entity, line: 237 in /home/u552734802/domains/dailystocktopick.com/public_html/index.php on line 141
Warning: DOMDocument::loadHTML(): Unexpected end tag : a in Entity, line: 237 in /home/u552734802/domains/dailystocktopick.com/public_html/index.php on line 141
Warning: DOMDocument::loadHTML(): Unexpected end tag : a in Entity, line: 237 in /home/u552734802/domains/dailystocktopick.com/public_html/index.php on line 141
Warning: DOMDocument::loadHTML(): Unexpected end tag : a in Entity, line: 237 in /home/u552734802/domains/dailystocktopick.com/public_html/index.php on line 141
Warning: DOMDocument::loadHTML(): Unexpected end tag : a in Entity, line: 237 in /home/u552734802/domains/dailystocktopick.com/public_html/index.php on line 141
Warning: DOMDocument::loadHTML(): Unexpected end tag : a in Entity, line: 237 in /home/u552734802/domains/dailystocktopick.com/public_html/index.php on line 141
Warning: DOMDocument::loadHTML(): Unexpected end tag : a in Entity, line: 237 in /home/u552734802/domains/dailystocktopick.com/public_html/index.php on line 141
Warning: DOMDocument::loadHTML(): Unexpected end tag : a in Entity, line: 237 in /home/u552734802/domains/dailystocktopick.com/public_html/index.php on line 141
Warning: DOMDocument::loadHTML(): Unexpected end tag : a in Entity, line: 237 in /home/u552734802/domains/dailystocktopick.com/public_html/index.php on line 141
Warning: DOMDocument::loadHTML(): Unexpected end tag : a in Entity, line: 237 in /home/u552734802/domains/dailystocktopick.com/public_html/index.php on line 141
Warning: DOMDocument::loadHTML(): Unexpected end tag : a in Entity, line: 237 in /home/u552734802/domains/dailystocktopick.com/public_html/index.php on line 141
Warning: DOMDocument::loadHTML(): Unexpected end tag : a in Entity, line: 237 in /home/u552734802/domains/dailystocktopick.com/public_html/index.php on line 141
Warning: DOMDocument::loadHTML(): Unexpected end tag : a in Entity, line: 237 in /home/u552734802/domains/dailystocktopick.com/public_html/index.php on line 141
Warning: DOMDocument::loadHTML(): Unexpected end tag : a in Entity, line: 237 in /home/u552734802/domains/dailystocktopick.com/public_html/index.php on line 141
Warning: DOMDocument::loadHTML(): Unexpected end tag : a in Entity, line: 237 in /home/u552734802/domains/dailystocktopick.com/public_html/index.php on line 141
Warning: DOMDocument::loadHTML(): Unexpected end tag : div in Entity, line: 237 in /home/u552734802/domains/dailystocktopick.com/public_html/index.php on line 141
Warning: DOMDocument::loadHTML(): Unexpected end tag : li in Entity, line: 237 in /home/u552734802/domains/dailystocktopick.com/public_html/index.php on line 141
Warning: DOMDocument::loadHTML(): Unexpected end tag : div in Entity, line: 237 in /home/u552734802/domains/dailystocktopick.com/public_html/index.php on line 141
Warning: DOMDocument::loadHTML(): Unexpected end tag : a in Entity, line: 237 in /home/u552734802/domains/dailystocktopick.com/public_html/index.php on line 141
Warning: DOMDocument::loadHTML(): Unexpected end tag : a in Entity, line: 237 in /home/u552734802/domains/dailystocktopick.com/public_html/index.php on line 141
Warning: DOMDocument::loadHTML(): Unexpected end tag : a in Entity, line: 237 in /home/u552734802/domains/dailystocktopick.com/public_html/index.php on line 141
Warning: DOMDocument::loadHTML(): Unexpected end tag : a in Entity, line: 237 in /home/u552734802/domains/dailystocktopick.com/public_html/index.php on line 141
Warning: DOMDocument::loadHTML(): Unexpected end tag : a in Entity, line: 237 in /home/u552734802/domains/dailystocktopick.com/public_html/index.php on line 141
Warning: DOMDocument::loadHTML(): Unexpected end tag : a in Entity, line: 237 in /home/u552734802/domains/dailystocktopick.com/public_html/index.php on line 141
Warning: DOMDocument::loadHTML(): Unexpected end tag : a in Entity, line: 237 in /home/u552734802/domains/dailystocktopick.com/public_html/index.php on line 141
Warning: DOMDocument::loadHTML(): Unexpected end tag : a in Entity, line: 237 in /home/u552734802/domains/dailystocktopick.com/public_html/index.php on line 141
Warning: DOMDocument::loadHTML(): Unexpected end tag : a in Entity, line: 237 in /home/u552734802/domains/dailystocktopick.com/public_html/index.php on line 141
Warning: DOMDocument::loadHTML(): Unexpected end tag : a in Entity, line: 237 in /home/u552734802/domains/dailystocktopick.com/public_html/index.php on line 141
Warning: DOMDocument::loadHTML(): Unexpected end tag : a in Entity, line: 237 in /home/u552734802/domains/dailystocktopick.com/public_html/index.php on line 141
Warning: DOMDocument::loadHTML(): Unexpected end tag : a in Entity, line: 237 in /home/u552734802/domains/dailystocktopick.com/public_html/index.php on line 141
Warning: DOMDocument::loadHTML(): Unexpected end tag : a in Entity, line: 237 in /home/u552734802/domains/dailystocktopick.com/public_html/index.php on line 141
Warning: DOMDocument::loadHTML(): Unexpected end tag : a in Entity, line: 237 in /home/u552734802/domains/dailystocktopick.com/public_html/index.php on line 141
Warning: DOMDocument::loadHTML(): Unexpected end tag : a in Entity, line: 237 in /home/u552734802/domains/dailystocktopick.com/public_html/index.php on line 141
Warning: DOMDocument::loadHTML(): Unexpected end tag : div in Entity, line: 237 in /home/u552734802/domains/dailystocktopick.com/public_html/index.php on line 141
Warning: DOMDocument::loadHTML(): Unexpected end tag : li in Entity, line: 237 in /home/u552734802/domains/dailystocktopick.com/public_html/index.php on line 141
Warning: DOMDocument::loadHTML(): Unexpected end tag : div in Entity, line: 237 in /home/u552734802/domains/dailystocktopick.com/public_html/index.php on line 141
Warning: DOMDocument::loadHTML(): Unexpected end tag : a in Entity, line: 237 in /home/u552734802/domains/dailystocktopick.com/public_html/index.php on line 141
Warning: DOMDocument::loadHTML(): Unexpected end tag : a in Entity, line: 237 in /home/u552734802/domains/dailystocktopick.com/public_html/index.php on line 141
Warning: DOMDocument::loadHTML(): Unexpected end tag : a in Entity, line: 237 in /home/u552734802/domains/dailystocktopick.com/public_html/index.php on line 141
Warning: DOMDocument::loadHTML(): Unexpected end tag : a in Entity, line: 237 in /home/u552734802/domains/dailystocktopick.com/public_html/index.php on line 141
Warning: DOMDocument::loadHTML(): Unexpected end tag : a in Entity, line: 237 in /home/u552734802/domains/dailystocktopick.com/public_html/index.php on line 141
Warning: DOMDocument::loadHTML(): Unexpected end tag : a in Entity, line: 237 in /home/u552734802/domains/dailystocktopick.com/public_html/index.php on line 141
Warning: DOMDocument::loadHTML(): Unexpected end tag : a in Entity, line: 237 in /home/u552734802/domains/dailystocktopick.com/public_html/index.php on line 141
Warning: DOMDocument::loadHTML(): Unexpected end tag : a in Entity, line: 237 in /home/u552734802/domains/dailystocktopick.com/public_html/index.php on line 141
Warning: DOMDocument::loadHTML(): Unexpected end tag : a in Entity, line: 237 in /home/u552734802/domains/dailystocktopick.com/public_html/index.php on line 141
Warning: DOMDocument::loadHTML(): Unexpected end tag : a in Entity, line: 237 in /home/u552734802/domains/dailystocktopick.com/public_html/index.php on line 141
Warning: DOMDocument::loadHTML(): Unexpected end tag : a in Entity, line: 237 in /home/u552734802/domains/dailystocktopick.com/public_html/index.php on line 141
Warning: DOMDocument::loadHTML(): Unexpected end tag : a in Entity, line: 237 in /home/u552734802/domains/dailystocktopick.com/public_html/index.php on line 141
Warning: DOMDocument::loadHTML(): Unexpected end tag : a in Entity, line: 237 in /home/u552734802/domains/dailystocktopick.com/public_html/index.php on line 141
Warning: DOMDocument::loadHTML(): Unexpected end tag : a in Entity, line: 237 in /home/u552734802/domains/dailystocktopick.com/public_html/index.php on line 141
Warning: DOMDocument::loadHTML(): Unexpected end tag : a in Entity, line: 237 in /home/u552734802/domains/dailystocktopick.com/public_html/index.php on line 141
Warning: DOMDocument::loadHTML(): Unexpected end tag : a in Entity, line: 237 in /home/u552734802/domains/dailystocktopick.com/public_html/index.php on line 141
Warning: DOMDocument::loadHTML(): Unexpected end tag : a in Entity, line: 237 in /home/u552734802/domains/dailystocktopick.com/public_html/index.php on line 141
Warning: DOMDocument::loadHTML(): Unexpected end tag : div in Entity, line: 237 in /home/u552734802/domains/dailystocktopick.com/public_html/index.php on line 141
Warning: DOMDocument::loadHTML(): Unexpected end tag : li in Entity, line: 237 in /home/u552734802/domains/dailystocktopick.com/public_html/index.php on line 141
Warning: DOMDocument::loadHTML(): Unexpected end tag : div in Entity, line: 237 in /home/u552734802/domains/dailystocktopick.com/public_html/index.php on line 141
Warning: DOMDocument::loadHTML(): Unexpected end tag : a in Entity, line: 237 in /home/u552734802/domains/dailystocktopick.com/public_html/index.php on line 141
Warning: DOMDocument::loadHTML(): Unexpected end tag : a in Entity, line: 237 in /home/u552734802/domains/dailystocktopick.com/public_html/index.php on line 141
Warning: DOMDocument::loadHTML(): Unexpected end tag : a in Entity, line: 237 in /home/u552734802/domains/dailystocktopick.com/public_html/index.php on line 141
Warning: DOMDocument::loadHTML(): Unexpected end tag : a in Entity, line: 237 in /home/u552734802/domains/dailystocktopick.com/public_html/index.php on line 141
Warning: DOMDocument::loadHTML(): Unexpected end tag : a in Entity, line: 237 in /home/u552734802/domains/dailystocktopick.com/public_html/index.php on line 141
Warning: DOMDocument::loadHTML(): Unexpected end tag : a in Entity, line: 237 in /home/u552734802/domains/dailystocktopick.com/public_html/index.php on line 141
Warning: DOMDocument::loadHTML(): Unexpected end tag : a in Entity, line: 237 in /home/u552734802/domains/dailystocktopick.com/public_html/index.php on line 141
Warning: DOMDocument::loadHTML(): Unexpected end tag : a in Entity, line: 237 in /home/u552734802/domains/dailystocktopick.com/public_html/index.php on line 141
Warning: DOMDocument::loadHTML(): Unexpected end tag : a in Entity, line: 237 in /home/u552734802/domains/dailystocktopick.com/public_html/index.php on line 141
Warning: DOMDocument::loadHTML(): Unexpected end tag : a in Entity, line: 237 in /home/u552734802/domains/dailystocktopick.com/public_html/index.php on line 141
Warning: DOMDocument::loadHTML(): Unexpected end tag : a in Entity, line: 237 in /home/u552734802/domains/dailystocktopick.com/public_html/index.php on line 141
Warning: DOMDocument::loadHTML(): Unexpected end tag : a in Entity, line: 237 in /home/u552734802/domains/dailystocktopick.com/public_html/index.php on line 141
Warning: DOMDocument::loadHTML(): Unexpected end tag : a in Entity, line: 237 in /home/u552734802/domains/dailystocktopick.com/public_html/index.php on line 141
Warning: DOMDocument::loadHTML(): Unexpected end tag : div in Entity, line: 237 in /home/u552734802/domains/dailystocktopick.com/public_html/index.php on line 141
Warning: DOMDocument::loadHTML(): Unexpected end tag : li in Entity, line: 237 in /home/u552734802/domains/dailystocktopick.com/public_html/index.php on line 141
Warning: DOMDocument::loadHTML(): Unexpected end tag : ul in Entity, line: 237 in /home/u552734802/domains/dailystocktopick.com/public_html/index.php on line 141
Warning: DOMDocument::loadHTML(): Unexpected end tag : h2 in Entity, line: 252 in /home/u552734802/domains/dailystocktopick.com/public_html/index.php on line 141
Warning: DOMDocument::loadHTML(): Unexpected end tag : p in Entity, line: 253 in /home/u552734802/domains/dailystocktopick.com/public_html/index.php on line 141
Warning: DOMDocument::loadHTML(): Unexpected end tag : button in Entity, line: 256 in /home/u552734802/domains/dailystocktopick.com/public_html/index.php on line 141
Warning: DOMDocument::loadHTML(): Unexpected end tag : div in Entity, line: 257 in /home/u552734802/domains/dailystocktopick.com/public_html/index.php on line 141
Warning: DOMDocument::loadHTML(): Unexpected end tag : i in Entity, line: 237 in /home/u552734802/domains/dailystocktopick.com/public_html/index.php on line 141
Warning: DOMDocument::loadHTML(): Unexpected end tag : span in Entity, line: 237 in /home/u552734802/domains/dailystocktopick.com/public_html/index.php on line 141
Warning: DOMDocument::loadHTML(): Unexpected end tag : div in Entity, line: 237 in /home/u552734802/domains/dailystocktopick.com/public_html/index.php on line 141
Warning: DOMDocument::loadHTML(): Unexpected end tag : div in Entity, line: 237 in /home/u552734802/domains/dailystocktopick.com/public_html/index.php on line 141
Warning: DOMDocument::loadHTML(): Unexpected end tag : a in Entity, line: 237 in /home/u552734802/domains/dailystocktopick.com/public_html/index.php on line 141
Warning: DOMDocument::loadHTML(): Unexpected end tag : a in Entity, line: 237 in /home/u552734802/domains/dailystocktopick.com/public_html/index.php on line 141
Warning: DOMDocument::loadHTML(): Unexpected end tag : a in Entity, line: 237 in /home/u552734802/domains/dailystocktopick.com/public_html/index.php on line 141
Warning: DOMDocument::loadHTML(): Unexpected end tag : a in Entity, line: 237 in /home/u552734802/domains/dailystocktopick.com/public_html/index.php on line 141
Warning: DOMDocument::loadHTML(): Unexpected end tag : a in Entity, line: 237 in /home/u552734802/domains/dailystocktopick.com/public_html/index.php on line 141
Warning: DOMDocument::loadHTML(): Unexpected end tag : a in Entity, line: 237 in /home/u552734802/domains/dailystocktopick.com/public_html/index.php on line 141
Warning: DOMDocument::loadHTML(): Unexpected end tag : a in Entity, line: 237 in /home/u552734802/domains/dailystocktopick.com/public_html/index.php on line 141
Warning: DOMDocument::loadHTML(): Unexpected end tag : a in Entity, line: 237 in /home/u552734802/domains/dailystocktopick.com/public_html/index.php on line 141
Warning: DOMDocument::loadHTML(): Unexpected end tag : a in Entity, line: 237 in /home/u552734802/domains/dailystocktopick.com/public_html/index.php on line 141
Warning: DOMDocument::loadHTML(): Unexpected end tag : a in Entity, line: 237 in /home/u552734802/domains/dailystocktopick.com/public_html/index.php on line 141
Warning: DOMDocument::loadHTML(): Unexpected end tag : a in Entity, line: 237 in /home/u552734802/domains/dailystocktopick.com/public_html/index.php on line 141
Warning: DOMDocument::loadHTML(): Unexpected end tag : div in Entity, line: 237 in /home/u552734802/domains/dailystocktopick.com/public_html/index.php on line 141
Warning: DOMDocument::loadHTML(): Unexpected end tag : li in Entity, line: 237 in /home/u552734802/domains/dailystocktopick.com/public_html/index.php on line 141
Warning: DOMDocument::loadHTML(): Unexpected end tag : div in Entity, line: 237 in /home/u552734802/domains/dailystocktopick.com/public_html/index.php on line 141
Warning: DOMDocument::loadHTML(): Unexpected end tag : a in Entity, line: 237 in /home/u552734802/domains/dailystocktopick.com/public_html/index.php on line 141
Warning: DOMDocument::loadHTML(): Unexpected end tag : a in Entity, line: 237 in /home/u552734802/domains/dailystocktopick.com/public_html/index.php on line 141
Warning: DOMDocument::loadHTML(): Unexpected end tag : a in Entity, line: 237 in /home/u552734802/domains/dailystocktopick.com/public_html/index.php on line 141
Warning: DOMDocument::loadHTML(): Unexpected end tag : a in Entity, line: 237 in /home/u552734802/domains/dailystocktopick.com/public_html/index.php on line 141
Warning: DOMDocument::loadHTML(): Unexpected end tag : a in Entity, line: 237 in /home/u552734802/domains/dailystocktopick.com/public_html/index.php on line 141
Warning: DOMDocument::loadHTML(): Unexpected end tag : a in Entity, line: 237 in /home/u552734802/domains/dailystocktopick.com/public_html/index.php on line 141
Warning: DOMDocument::loadHTML(): Unexpected end tag : a in Entity, line: 237 in /home/u552734802/domains/dailystocktopick.com/public_html/index.php on line 141
Warning: DOMDocument::loadHTML(): Unexpected end tag : a in Entity, line: 237 in /home/u552734802/domains/dailystocktopick.com/public_html/index.php on line 141
Warning: DOMDocument::loadHTML(): Unexpected end tag : a in Entity, line: 237 in /home/u552734802/domains/dailystocktopick.com/public_html/index.php on line 141
Warning: DOMDocument::loadHTML(): Unexpected end tag : a in Entity, line: 237 in /home/u552734802/domains/dailystocktopick.com/public_html/index.php on line 141
Warning: DOMDocument::loadHTML(): Unexpected end tag : a in Entity, line: 237 in /home/u552734802/domains/dailystocktopick.com/public_html/index.php on line 141
Warning: DOMDocument::loadHTML(): Unexpected end tag : a in Entity, line: 237 in /home/u552734802/domains/dailystocktopick.com/public_html/index.php on line 141
Warning: DOMDocument::loadHTML(): Unexpected end tag : div in Entity, line: 237 in /home/u552734802/domains/dailystocktopick.com/public_html/index.php on line 141
Warning: DOMDocument::loadHTML(): Unexpected end tag : li in Entity, line: 237 in /home/u552734802/domains/dailystocktopick.com/public_html/index.php on line 141
Warning: DOMDocument::loadHTML(): Unexpected end tag : div in Entity, line: 237 in /home/u552734802/domains/dailystocktopick.com/public_html/index.php on line 141
Warning: DOMDocument::loadHTML(): Unexpected end tag : a in Entity, line: 237 in /home/u552734802/domains/dailystocktopick.com/public_html/index.php on line 141
Warning: DOMDocument::loadHTML(): Unexpected end tag : a in Entity, line: 237 in /home/u552734802/domains/dailystocktopick.com/public_html/index.php on line 141
Warning: DOMDocument::loadHTML(): Unexpected end tag : a in Entity, line: 237 in /home/u552734802/domains/dailystocktopick.com/public_html/index.php on line 141
Warning: DOMDocument::loadHTML(): Unexpected end tag : a in Entity, line: 237 in /home/u552734802/domains/dailystocktopick.com/public_html/index.php on line 141
Warning: DOMDocument::loadHTML(): Unexpected end tag : a in Entity, line: 237 in /home/u552734802/domains/dailystocktopick.com/public_html/index.php on line 141
Warning: DOMDocument::loadHTML(): Unexpected end tag : a in Entity, line: 237 in /home/u552734802/domains/dailystocktopick.com/public_html/index.php on line 141
Warning: DOMDocument::loadHTML(): Unexpected end tag : a in Entity, line: 237 in /home/u552734802/domains/dailystocktopick.com/public_html/index.php on line 141
Warning: DOMDocument::loadHTML(): Unexpected end tag : a in Entity, line: 237 in /home/u552734802/domains/dailystocktopick.com/public_html/index.php on line 141
Warning: DOMDocument::loadHTML(): Unexpected end tag : div in Entity, line: 237 in /home/u552734802/domains/dailystocktopick.com/public_html/index.php on line 141
Warning: DOMDocument::loadHTML(): Unexpected end tag : li in Entity, line: 237 in /home/u552734802/domains/dailystocktopick.com/public_html/index.php on line 141
Warning: DOMDocument::loadHTML(): Unexpected end tag : div in Entity, line: 237 in /home/u552734802/domains/dailystocktopick.com/public_html/index.php on line 141
Warning: DOMDocument::loadHTML(): Unexpected end tag : a in Entity, line: 237 in /home/u552734802/domains/dailystocktopick.com/public_html/index.php on line 141
Warning: DOMDocument::loadHTML(): Unexpected end tag : a in Entity, line: 237 in /home/u552734802/domains/dailystocktopick.com/public_html/index.php on line 141
Warning: DOMDocument::loadHTML(): Unexpected end tag : a in Entity, line: 237 in /home/u552734802/domains/dailystocktopick.com/public_html/index.php on line 141
Warning: DOMDocument::loadHTML(): Unexpected end tag : a in Entity, line: 237 in /home/u552734802/domains/dailystocktopick.com/public_html/index.php on line 141
Warning: DOMDocument::loadHTML(): Unexpected end tag : a in Entity, line: 237 in /home/u552734802/domains/dailystocktopick.com/public_html/index.php on line 141
Warning: DOMDocument::loadHTML(): Unexpected end tag : a in Entity, line: 237 in /home/u552734802/domains/dailystocktopick.com/public_html/index.php on line 141
Warning: DOMDocument::loadHTML(): Unexpected end tag : a in Entity, line: 237 in /home/u552734802/domains/dailystocktopick.com/public_html/index.php on line 141
Warning: DOMDocument::loadHTML(): Unexpected end tag : a in Entity, line: 237 in /home/u552734802/domains/dailystocktopick.com/public_html/index.php on line 141
Warning: DOMDocument::loadHTML(): Unexpected end tag : a in Entity, line: 237 in /home/u552734802/domains/dailystocktopick.com/public_html/index.php on line 141
Warning: DOMDocument::loadHTML(): Unexpected end tag : a in Entity, line: 237 in /home/u552734802/domains/dailystocktopick.com/public_html/index.php on line 141
Warning: DOMDocument::loadHTML(): Unexpected end tag : a in Entity, line: 237 in /home/u552734802/domains/dailystocktopick.com/public_html/index.php on line 141
Warning: DOMDocument::loadHTML(): Unexpected end tag : a in Entity, line: 237 in /home/u552734802/domains/dailystocktopick.com/public_html/index.php on line 141
Warning: DOMDocument::loadHTML(): Unexpected end tag : div in Entity, line: 237 in /home/u552734802/domains/dailystocktopick.com/public_html/index.php on line 141
Warning: DOMDocument::loadHTML(): Unexpected end tag : li in Entity, line: 237 in /home/u552734802/domains/dailystocktopick.com/public_html/index.php on line 141
Warning: DOMDocument::loadHTML(): Unexpected end tag : div in Entity, line: 237 in /home/u552734802/domains/dailystocktopick.com/public_html/index.php on line 141
Warning: DOMDocument::loadHTML(): Unexpected end tag : a in Entity, line: 237 in /home/u552734802/domains/dailystocktopick.com/public_html/index.php on line 141
Warning: DOMDocument::loadHTML(): Unexpected end tag : a in Entity, line: 237 in /home/u552734802/domains/dailystocktopick.com/public_html/index.php on line 141
Warning: DOMDocument::loadHTML(): Unexpected end tag : a in Entity, line: 237 in /home/u552734802/domains/dailystocktopick.com/public_html/index.php on line 141
Warning: DOMDocument::loadHTML(): Unexpected end tag : a in Entity, line: 237 in /home/u552734802/domains/dailystocktopick.com/public_html/index.php on line 141
Warning: DOMDocument::loadHTML(): Unexpected end tag : a in Entity, line: 237 in /home/u552734802/domains/dailystocktopick.com/public_html/index.php on line 141
Warning: DOMDocument::loadHTML(): Unexpected end tag : a in Entity, line: 237 in /home/u552734802/domains/dailystocktopick.com/public_html/index.php on line 141
Warning: DOMDocument::loadHTML(): Unexpected end tag : div in Entity, line: 237 in /home/u552734802/domains/dailystocktopick.com/public_html/index.php on line 141
Warning: DOMDocument::loadHTML(): Unexpected end tag : li in Entity, line: 237 in /home/u552734802/domains/dailystocktopick.com/public_html/index.php on line 141
Warning: DOMDocument::loadHTML(): Unexpected end tag : div in Entity, line: 237 in /home/u552734802/domains/dailystocktopick.com/public_html/index.php on line 141
Warning: DOMDocument::loadHTML(): Unexpected end tag : a in Entity, line: 237 in /home/u552734802/domains/dailystocktopick.com/public_html/index.php on line 141
Warning: DOMDocument::loadHTML(): Unexpected end tag : a in Entity, line: 237 in /home/u552734802/domains/dailystocktopick.com/public_html/index.php on line 141
Warning: DOMDocument::loadHTML(): Unexpected end tag : a in Entity, line: 237 in /home/u552734802/domains/dailystocktopick.com/public_html/index.php on line 141
Warning: DOMDocument::loadHTML(): Unexpected end tag : a in Entity, line: 237 in /home/u552734802/domains/dailystocktopick.com/public_html/index.php on line 141
Warning: DOMDocument::loadHTML(): Unexpected end tag : a in Entity, line: 237 in /home/u552734802/domains/dailystocktopick.com/public_html/index.php on line 141
Warning: DOMDocument::loadHTML(): Unexpected end tag : a in Entity, line: 237 in /home/u552734802/domains/dailystocktopick.com/public_html/index.php on line 141
Warning: DOMDocument::loadHTML(): Unexpected end tag : a in Entity, line: 237 in /home/u552734802/domains/dailystocktopick.com/public_html/index.php on line 141
Warning: DOMDocument::loadHTML(): Unexpected end tag : a in Entity, line: 237 in /home/u552734802/domains/dailystocktopick.com/public_html/index.php on line 141
Warning: DOMDocument::loadHTML(): Unexpected end tag : a in Entity, line: 237 in /home/u552734802/domains/dailystocktopick.com/public_html/index.php on line 141
Warning: DOMDocument::loadHTML(): Unexpected end tag : a in Entity, line: 237 in /home/u552734802/domains/dailystocktopick.com/public_html/index.php on line 141
Warning: DOMDocument::loadHTML(): Unexpected end tag : a in Entity, line: 237 in /home/u552734802/domains/dailystocktopick.com/public_html/index.php on line 141
Warning: DOMDocument::loadHTML(): Unexpected end tag : a in Entity, line: 237 in /home/u552734802/domains/dailystocktopick.com/public_html/index.php on line 141
Warning: DOMDocument::loadHTML(): Unexpected end tag : a in Entity, line: 237 in /home/u552734802/domains/dailystocktopick.com/public_html/index.php on line 141
Warning: DOMDocument::loadHTML(): Unexpected end tag : a in Entity, line: 237 in /home/u552734802/domains/dailystocktopick.com/public_html/index.php on line 141
Warning: DOMDocument::loadHTML(): Unexpected end tag : a in Entity, line: 237 in /home/u552734802/domains/dailystocktopick.com/public_html/index.php on line 141
Warning: DOMDocument::loadHTML(): Unexpected end tag : a in Entity, line: 237 in /home/u552734802/domains/dailystocktopick.com/public_html/index.php on line 141
Warning: DOMDocument::loadHTML(): Unexpected end tag : a in Entity, line: 237 in /home/u552734802/domains/dailystocktopick.com/public_html/index.php on line 141
Warning: DOMDocument::loadHTML(): Unexpected end tag : a in Entity, line: 237 in /home/u552734802/domains/dailystocktopick.com/public_html/index.php on line 141
Warning: DOMDocument::loadHTML(): Unexpected end tag : div in Entity, line: 237 in /home/u552734802/domains/dailystocktopick.com/public_html/index.php on line 141
Warning: DOMDocument::loadHTML(): Unexpected end tag : li in Entity, line: 237 in /home/u552734802/domains/dailystocktopick.com/public_html/index.php on line 141
Warning: DOMDocument::loadHTML(): Unexpected end tag : div in Entity, line: 237 in /home/u552734802/domains/dailystocktopick.com/public_html/index.php on line 141
Warning: DOMDocument::loadHTML(): Unexpected end tag : a in Entity, line: 237 in /home/u552734802/domains/dailystocktopick.com/public_html/index.php on line 141
Warning: DOMDocument::loadHTML(): Unexpected end tag : a in Entity, line: 237 in /home/u552734802/domains/dailystocktopick.com/public_html/index.php on line 141
Warning: DOMDocument::loadHTML(): Unexpected end tag : a in Entity, line: 237 in /home/u552734802/domains/dailystocktopick.com/public_html/index.php on line 141
Warning: DOMDocument::loadHTML(): Unexpected end tag : a in Entity, line: 237 in /home/u552734802/domains/dailystocktopick.com/public_html/index.php on line 141
Warning: DOMDocument::loadHTML(): Unexpected end tag : a in Entity, line: 237 in /home/u552734802/domains/dailystocktopick.com/public_html/index.php on line 141
Warning: DOMDocument::loadHTML(): Unexpected end tag : a in Entity, line: 237 in /home/u552734802/domains/dailystocktopick.com/public_html/index.php on line 141
Warning: DOMDocument::loadHTML(): Unexpected end tag : a in Entity, line: 237 in /home/u552734802/domains/dailystocktopick.com/public_html/index.php on line 141
Warning: DOMDocument::loadHTML(): Unexpected end tag : a in Entity, line: 237 in /home/u552734802/domains/dailystocktopick.com/public_html/index.php on line 141
Warning: DOMDocument::loadHTML(): Unexpected end tag : a in Entity, line: 237 in /home/u552734802/domains/dailystocktopick.com/public_html/index.php on line 141
Warning: DOMDocument::loadHTML(): Unexpected end tag : a in Entity, line: 237 in /home/u552734802/domains/dailystocktopick.com/public_html/index.php on line 141
Warning: DOMDocument::loadHTML(): Unexpected end tag : a in Entity, line: 237 in /home/u552734802/domains/dailystocktopick.com/public_html/index.php on line 141
Warning: DOMDocument::loadHTML(): Unexpected end tag : a in Entity, line: 237 in /home/u552734802/domains/dailystocktopick.com/public_html/index.php on line 141
Warning: DOMDocument::loadHTML(): Unexpected end tag : a in Entity, line: 237 in /home/u552734802/domains/dailystocktopick.com/public_html/index.php on line 141
Warning: DOMDocument::loadHTML(): Unexpected end tag : a in Entity, line: 237 in /home/u552734802/domains/dailystocktopick.com/public_html/index.php on line 141
Warning: DOMDocument::loadHTML(): Unexpected end tag : a in Entity, line: 237 in /home/u552734802/domains/dailystocktopick.com/public_html/index.php on line 141
Warning: DOMDocument::loadHTML(): Unexpected end tag : div in Entity, line: 237 in /home/u552734802/domains/dailystocktopick.com/public_html/index.php on line 141
Warning: DOMDocument::loadHTML(): Unexpected end tag : li in Entity, line: 237 in /home/u552734802/domains/dailystocktopick.com/public_html/index.php on line 141
Warning: DOMDocument::loadHTML(): Unexpected end tag : div in Entity, line: 237 in /home/u552734802/domains/dailystocktopick.com/public_html/index.php on line 141
Warning: DOMDocument::loadHTML(): Unexpected end tag : a in Entity, line: 237 in /home/u552734802/domains/dailystocktopick.com/public_html/index.php on line 141
Warning: DOMDocument::loadHTML(): Unexpected end tag : a in Entity, line: 237 in /home/u552734802/domains/dailystocktopick.com/public_html/index.php on line 141
Warning: DOMDocument::loadHTML(): Unexpected end tag : a in Entity, line: 237 in /home/u552734802/domains/dailystocktopick.com/public_html/index.php on line 141
Warning: DOMDocument::loadHTML(): Unexpected end tag : a in Entity, line: 237 in /home/u552734802/domains/dailystocktopick.com/public_html/index.php on line 141
Warning: DOMDocument::loadHTML(): Unexpected end tag : a in Entity, line: 237 in /home/u552734802/domains/dailystocktopick.com/public_html/index.php on line 141
Warning: DOMDocument::loadHTML(): Unexpected end tag : a in Entity, line: 237 in /home/u552734802/domains/dailystocktopick.com/public_html/index.php on line 141
Warning: DOMDocument::loadHTML(): Unexpected end tag : a in Entity, line: 237 in /home/u552734802/domains/dailystocktopick.com/public_html/index.php on line 141
Warning: DOMDocument::loadHTML(): Unexpected end tag : a in Entity, line: 237 in /home/u552734802/domains/dailystocktopick.com/public_html/index.php on line 141
Warning: DOMDocument::loadHTML(): Unexpected end tag : a in Entity, line: 237 in /home/u552734802/domains/dailystocktopick.com/public_html/index.php on line 141
Warning: DOMDocument::loadHTML(): Unexpected end tag : a in Entity, line: 237 in /home/u552734802/domains/dailystocktopick.com/public_html/index.php on line 141
Warning: DOMDocument::loadHTML(): Unexpected end tag : a in Entity, line: 237 in /home/u552734802/domains/dailystocktopick.com/public_html/index.php on line 141
Warning: DOMDocument::loadHTML(): Unexpected end tag : a in Entity, line: 237 in /home/u552734802/domains/dailystocktopick.com/public_html/index.php on line 141
Warning: DOMDocument::loadHTML(): Unexpected end tag : a in Entity, line: 237 in /home/u552734802/domains/dailystocktopick.com/public_html/index.php on line 141
Warning: DOMDocument::loadHTML(): Unexpected end tag : div in Entity, line: 237 in /home/u552734802/domains/dailystocktopick.com/public_html/index.php on line 141
Warning: DOMDocument::loadHTML(): Unexpected end tag : li in Entity, line: 237 in /home/u552734802/domains/dailystocktopick.com/public_html/index.php on line 141
Warning: DOMDocument::loadHTML(): Unexpected end tag : div in Entity, line: 237 in /home/u552734802/domains/dailystocktopick.com/public_html/index.php on line 141
Warning: DOMDocument::loadHTML(): Unexpected end tag : a in Entity, line: 237 in /home/u552734802/domains/dailystocktopick.com/public_html/index.php on line 141
Warning: DOMDocument::loadHTML(): Unexpected end tag : a in Entity, line: 237 in /home/u552734802/domains/dailystocktopick.com/public_html/index.php on line 141
Warning: DOMDocument::loadHTML(): Unexpected end tag : a in Entity, line: 237 in /home/u552734802/domains/dailystocktopick.com/public_html/index.php on line 141
Warning: DOMDocument::loadHTML(): Unexpected end tag : a in Entity, line: 237 in /home/u552734802/domains/dailystocktopick.com/public_html/index.php on line 141
Warning: DOMDocument::loadHTML(): Unexpected end tag : a in Entity, line: 237 in /home/u552734802/domains/dailystocktopick.com/public_html/index.php on line 141
Warning: DOMDocument::loadHTML(): Unexpected end tag : a in Entity, line: 237 in /home/u552734802/domains/dailystocktopick.com/public_html/index.php on line 141
Warning: DOMDocument::loadHTML(): Unexpected end tag : a in Entity, line: 237 in /home/u552734802/domains/dailystocktopick.com/public_html/index.php on line 141
Warning: DOMDocument::loadHTML(): Unexpected end tag : a in Entity, line: 237 in /home/u552734802/domains/dailystocktopick.com/public_html/index.php on line 141
Warning: DOMDocument::loadHTML(): Unexpected end tag : a in Entity, line: 237 in /home/u552734802/domains/dailystocktopick.com/public_html/index.php on line 141
Warning: DOMDocument::loadHTML(): Unexpected end tag : a in Entity, line: 237 in /home/u552734802/domains/dailystocktopick.com/public_html/index.php on line 141
Warning: DOMDocument::loadHTML(): Unexpected end tag : a in Entity, line: 237 in /home/u552734802/domains/dailystocktopick.com/public_html/index.php on line 141
Warning: DOMDocument::loadHTML(): Unexpected end tag : a in Entity, line: 237 in /home/u552734802/domains/dailystocktopick.com/public_html/index.php on line 141
Warning: DOMDocument::loadHTML(): Unexpected end tag : a in Entity, line: 237 in /home/u552734802/domains/dailystocktopick.com/public_html/index.php on line 141
Warning: DOMDocument::loadHTML(): Unexpected end tag : a in Entity, line: 237 in /home/u552734802/domains/dailystocktopick.com/public_html/index.php on line 141
Warning: DOMDocument::loadHTML(): Unexpected end tag : a in Entity, line: 237 in /home/u552734802/domains/dailystocktopick.com/public_html/index.php on line 141
Warning: DOMDocument::loadHTML(): Unexpected end tag : a in Entity, line: 237 in /home/u552734802/domains/dailystocktopick.com/public_html/index.php on line 141
Warning: DOMDocument::loadHTML(): Unexpected end tag : div in Entity, line: 237 in /home/u552734802/domains/dailystocktopick.com/public_html/index.php on line 141
Warning: DOMDocument::loadHTML(): Unexpected end tag : li in Entity, line: 237 in /home/u552734802/domains/dailystocktopick.com/public_html/index.php on line 141
Warning: DOMDocument::loadHTML(): Unexpected end tag : div in Entity, line: 237 in /home/u552734802/domains/dailystocktopick.com/public_html/index.php on line 141
Warning: DOMDocument::loadHTML(): Unexpected end tag : a in Entity, line: 237 in /home/u552734802/domains/dailystocktopick.com/public_html/index.php on line 141
Warning: DOMDocument::loadHTML(): Unexpected end tag : a in Entity, line: 237 in /home/u552734802/domains/dailystocktopick.com/public_html/index.php on line 141
Warning: DOMDocument::loadHTML(): Unexpected end tag : a in Entity, line: 237 in /home/u552734802/domains/dailystocktopick.com/public_html/index.php on line 141
Warning: DOMDocument::loadHTML(): Unexpected end tag : a in Entity, line: 237 in /home/u552734802/domains/dailystocktopick.com/public_html/index.php on line 141
Warning: DOMDocument::loadHTML(): Unexpected end tag : a in Entity, line: 237 in /home/u552734802/domains/dailystocktopick.com/public_html/index.php on line 141
Warning: DOMDocument::loadHTML(): Unexpected end tag : a in Entity, line: 237 in /home/u552734802/domains/dailystocktopick.com/public_html/index.php on line 141
Warning: DOMDocument::loadHTML(): Unexpected end tag : a in Entity, line: 237 in /home/u552734802/domains/dailystocktopick.com/public_html/index.php on line 141
Warning: DOMDocument::loadHTML(): Unexpected end tag : a in Entity, line: 237 in /home/u552734802/domains/dailystocktopick.com/public_html/index.php on line 141
Warning: DOMDocument::loadHTML(): Unexpected end tag : a in Entity, line: 237 in /home/u552734802/domains/dailystocktopick.com/public_html/index.php on line 141
Warning: DOMDocument::loadHTML(): Unexpected end tag : a in Entity, line: 237 in /home/u552734802/domains/dailystocktopick.com/public_html/index.php on line 141
Warning: DOMDocument::loadHTML(): Unexpected end tag : a in Entity, line: 237 in /home/u552734802/domains/dailystocktopick.com/public_html/index.php on line 141
Warning: DOMDocument::loadHTML(): Unexpected end tag : a in Entity, line: 237 in /home/u552734802/domains/dailystocktopick.com/public_html/index.php on line 141
Warning: DOMDocument::loadHTML(): Unexpected end tag : a in Entity, line: 237 in /home/u552734802/domains/dailystocktopick.com/public_html/index.php on line 141
Warning: DOMDocument::loadHTML(): Unexpected end tag : a in Entity, line: 237 in /home/u552734802/domains/dailystocktopick.com/public_html/index.php on line 141
Warning: DOMDocument::loadHTML(): Unexpected end tag : a in Entity, line: 237 in /home/u552734802/domains/dailystocktopick.com/public_html/index.php on line 141
Warning: DOMDocument::loadHTML(): Unexpected end tag : a in Entity, line: 237 in /home/u552734802/domains/dailystocktopick.com/public_html/index.php on line 141
Warning: DOMDocument::loadHTML(): Unexpected end tag : div in Entity, line: 237 in /home/u552734802/domains/dailystocktopick.com/public_html/index.php on line 141
Warning: DOMDocument::loadHTML(): Unexpected end tag : li in Entity, line: 237 in /home/u552734802/domains/dailystocktopick.com/public_html/index.php on line 141
Warning: DOMDocument::loadHTML(): Unexpected end tag : div in Entity, line: 237 in /home/u552734802/domains/dailystocktopick.com/public_html/index.php on line 141
Warning: DOMDocument::loadHTML(): Unexpected end tag : a in Entity, line: 237 in /home/u552734802/domains/dailystocktopick.com/public_html/index.php on line 141
Warning: DOMDocument::loadHTML(): Unexpected end tag : a in Entity, line: 237 in /home/u552734802/domains/dailystocktopick.com/public_html/index.php on line 141
Warning: DOMDocument::loadHTML(): Unexpected end tag : a in Entity, line: 237 in /home/u552734802/domains/dailystocktopick.com/public_html/index.php on line 141
Warning: DOMDocument::loadHTML(): Unexpected end tag : a in Entity, line: 237 in /home/u552734802/domains/dailystocktopick.com/public_html/index.php on line 141
Warning: DOMDocument::loadHTML(): Unexpected end tag : a in Entity, line: 237 in /home/u552734802/domains/dailystocktopick.com/public_html/index.php on line 141
Warning: DOMDocument::loadHTML(): Unexpected end tag : a in Entity, line: 237 in /home/u552734802/domains/dailystocktopick.com/public_html/index.php on line 141
Warning: DOMDocument::loadHTML(): Unexpected end tag : a in Entity, line: 237 in /home/u552734802/domains/dailystocktopick.com/public_html/index.php on line 141
Warning: DOMDocument::loadHTML(): Unexpected end tag : a in Entity, line: 237 in /home/u552734802/domains/dailystocktopick.com/public_html/index.php on line 141
Warning: DOMDocument::loadHTML(): Unexpected end tag : a in Entity, line: 237 in /home/u552734802/domains/dailystocktopick.com/public_html/index.php on line 141
Warning: DOMDocument::loadHTML(): Unexpected end tag : a in Entity, line: 237 in /home/u552734802/domains/dailystocktopick.com/public_html/index.php on line 141
Warning: DOMDocument::loadHTML(): Unexpected end tag : a in Entity, line: 237 in /home/u552734802/domains/dailystocktopick.com/public_html/index.php on line 141
Warning: DOMDocument::loadHTML(): Unexpected end tag : a in Entity, line: 237 in /home/u552734802/domains/dailystocktopick.com/public_html/index.php on line 141
Warning: DOMDocument::loadHTML(): Unexpected end tag : a in Entity, line: 237 in /home/u552734802/domains/dailystocktopick.com/public_html/index.php on line 141
Warning: DOMDocument::loadHTML(): Unexpected end tag : a in Entity, line: 237 in /home/u552734802/domains/dailystocktopick.com/public_html/index.php on line 141
Warning: DOMDocument::loadHTML(): Unexpected end tag : a in Entity, line: 237 in /home/u552734802/domains/dailystocktopick.com/public_html/index.php on line 141
Warning: DOMDocument::loadHTML(): Unexpected end tag : a in Entity, line: 237 in /home/u552734802/domains/dailystocktopick.com/public_html/index.php on line 141
Warning: DOMDocument::loadHTML(): Unexpected end tag : a in Entity, line: 237 in /home/u552734802/domains/dailystocktopick.com/public_html/index.php on line 141
Warning: DOMDocument::loadHTML(): Unexpected end tag : a in Entity, line: 237 in /home/u552734802/domains/dailystocktopick.com/public_html/index.php on line 141
Warning: DOMDocument::loadHTML(): Unexpected end tag : div in Entity, line: 237 in /home/u552734802/domains/dailystocktopick.com/public_html/index.php on line 141
Warning: DOMDocument::loadHTML(): Unexpected end tag : li in Entity, line: 237 in /home/u552734802/domains/dailystocktopick.com/public_html/index.php on line 141
Warning: DOMDocument::loadHTML(): Unexpected end tag : div in Entity, line: 237 in /home/u552734802/domains/dailystocktopick.com/public_html/index.php on line 141
Warning: DOMDocument::loadHTML(): Unexpected end tag : a in Entity, line: 237 in /home/u552734802/domains/dailystocktopick.com/public_html/index.php on line 141
Warning: DOMDocument::loadHTML(): Unexpected end tag : a in Entity, line: 237 in /home/u552734802/domains/dailystocktopick.com/public_html/index.php on line 141
Warning: DOMDocument::loadHTML(): Unexpected end tag : a in Entity, line: 237 in /home/u552734802/domains/dailystocktopick.com/public_html/index.php on line 141
Warning: DOMDocument::loadHTML(): Unexpected end tag : a in Entity, line: 237 in /home/u552734802/domains/dailystocktopick.com/public_html/index.php on line 141
Warning: DOMDocument::loadHTML(): Unexpected end tag : a in Entity, line: 237 in /home/u552734802/domains/dailystocktopick.com/public_html/index.php on line 141
Warning: DOMDocument::loadHTML(): Unexpected end tag : a in Entity, line: 237 in /home/u552734802/domains/dailystocktopick.com/public_html/index.php on line 141
Warning: DOMDocument::loadHTML(): Unexpected end tag : a in Entity, line: 237 in /home/u552734802/domains/dailystocktopick.com/public_html/index.php on line 141
Warning: DOMDocument::loadHTML(): Unexpected end tag : a in Entity, line: 237 in /home/u552734802/domains/dailystocktopick.com/public_html/index.php on line 141
Warning: DOMDocument::loadHTML(): Unexpected end tag : a in Entity, line: 237 in /home/u552734802/domains/dailystocktopick.com/public_html/index.php on line 141
Warning: DOMDocument::loadHTML(): Unexpected end tag : a in Entity, line: 237 in /home/u552734802/domains/dailystocktopick.com/public_html/index.php on line 141
Warning: DOMDocument::loadHTML(): Unexpected end tag : div in Entity, line: 237 in /home/u552734802/domains/dailystocktopick.com/public_html/index.php on line 141
Warning: DOMDocument::loadHTML(): Unexpected end tag : li in Entity, line: 237 in /home/u552734802/domains/dailystocktopick.com/public_html/index.php on line 141
Warning: DOMDocument::loadHTML(): Unexpected end tag : div in Entity, line: 237 in /home/u552734802/domains/dailystocktopick.com/public_html/index.php on line 141
Warning: DOMDocument::loadHTML(): Unexpected end tag : a in Entity, line: 237 in /home/u552734802/domains/dailystocktopick.com/public_html/index.php on line 141
Warning: DOMDocument::loadHTML(): Unexpected end tag : a in Entity, line: 237 in /home/u552734802/domains/dailystocktopick.com/public_html/index.php on line 141
Warning: DOMDocument::loadHTML(): Unexpected end tag : a in Entity, line: 237 in /home/u552734802/domains/dailystocktopick.com/public_html/index.php on line 141
Warning: DOMDocument::loadHTML(): Unexpected end tag : a in Entity, line: 237 in /home/u552734802/domains/dailystocktopick.com/public_html/index.php on line 141
Warning: DOMDocument::loadHTML(): Unexpected end tag : a in Entity, line: 237 in /home/u552734802/domains/dailystocktopick.com/public_html/index.php on line 141
Warning: DOMDocument::loadHTML(): Unexpected end tag : a in Entity, line: 237 in /home/u552734802/domains/dailystocktopick.com/public_html/index.php on line 141
Warning: DOMDocument::loadHTML(): Unexpected end tag : a in Entity, line: 237 in /home/u552734802/domains/dailystocktopick.com/public_html/index.php on line 141
Warning: DOMDocument::loadHTML(): Unexpected end tag : a in Entity, line: 237 in /home/u552734802/domains/dailystocktopick.com/public_html/index.php on line 141
Warning: DOMDocument::loadHTML(): Unexpected end tag : a in Entity, line: 237 in /home/u552734802/domains/dailystocktopick.com/public_html/index.php on line 141
Warning: DOMDocument::loadHTML(): Unexpected end tag : a in Entity, line: 237 in /home/u552734802/domains/dailystocktopick.com/public_html/index.php on line 141
Warning: DOMDocument::loadHTML(): Unexpected end tag : div in Entity, line: 237 in /home/u552734802/domains/dailystocktopick.com/public_html/index.php on line 141
Warning: DOMDocument::loadHTML(): Unexpected end tag : li in Entity, line: 237 in /home/u552734802/domains/dailystocktopick.com/public_html/index.php on line 141
Warning: DOMDocument::loadHTML(): Unexpected end tag : div in Entity, line: 237 in /home/u552734802/domains/dailystocktopick.com/public_html/index.php on line 141
Warning: DOMDocument::loadHTML(): Unexpected end tag : a in Entity, line: 237 in /home/u552734802/domains/dailystocktopick.com/public_html/index.php on line 141
Warning: DOMDocument::loadHTML(): Unexpected end tag : a in Entity, line: 237 in /home/u552734802/domains/dailystocktopick.com/public_html/index.php on line 141
Warning: DOMDocument::loadHTML(): Unexpected end tag : a in Entity, line: 237 in /home/u552734802/domains/dailystocktopick.com/public_html/index.php on line 141
Warning: DOMDocument::loadHTML(): Unexpected end tag : a in Entity, line: 237 in /home/u552734802/domains/dailystocktopick.com/public_html/index.php on line 141
Warning: DOMDocument::loadHTML(): Unexpected end tag : a in Entity, line: 237 in /home/u552734802/domains/dailystocktopick.com/public_html/index.php on line 141
Warning: DOMDocument::loadHTML(): Unexpected end tag : a in Entity, line: 237 in /home/u552734802/domains/dailystocktopick.com/public_html/index.php on line 141
Warning: DOMDocument::loadHTML(): Unexpected end tag : a in Entity, line: 237 in /home/u552734802/domains/dailystocktopick.com/public_html/index.php on line 141
Warning: DOMDocument::loadHTML(): Unexpected end tag : a in Entity, line: 237 in /home/u552734802/domains/dailystocktopick.com/public_html/index.php on line 141
Warning: DOMDocument::loadHTML(): Unexpected end tag : a in Entity, line: 237 in /home/u552734802/domains/dailystocktopick.com/public_html/index.php on line 141
Warning: DOMDocument::loadHTML(): Unexpected end tag : a in Entity, line: 237 in /home/u552734802/domains/dailystocktopick.com/public_html/index.php on line 141
Warning: DOMDocument::loadHTML(): Unexpected end tag : a in Entity, line: 237 in /home/u552734802/domains/dailystocktopick.com/public_html/index.php on line 141
Warning: DOMDocument::loadHTML(): Unexpected end tag : div in Entity, line: 237 in /home/u552734802/domains/dailystocktopick.com/public_html/index.php on line 141
Warning: DOMDocument::loadHTML(): Unexpected end tag : li in Entity, line: 237 in /home/u552734802/domains/dailystocktopick.com/public_html/index.php on line 141
Warning: DOMDocument::loadHTML(): Unexpected end tag : div in Entity, line: 237 in /home/u552734802/domains/dailystocktopick.com/public_html/index.php on line 141
Warning: DOMDocument::loadHTML(): Unexpected end tag : a in Entity, line: 237 in /home/u552734802/domains/dailystocktopick.com/public_html/index.php on line 141
Warning: DOMDocument::loadHTML(): Unexpected end tag : a in Entity, line: 237 in /home/u552734802/domains/dailystocktopick.com/public_html/index.php on line 141
Warning: DOMDocument::loadHTML(): Unexpected end tag : a in Entity, line: 237 in /home/u552734802/domains/dailystocktopick.com/public_html/index.php on line 141
Warning: DOMDocument::loadHTML(): Unexpected end tag : a in Entity, line: 237 in /home/u552734802/domains/dailystocktopick.com/public_html/index.php on line 141
Warning: DOMDocument::loadHTML(): Unexpected end tag : a in Entity, line: 237 in /home/u552734802/domains/dailystocktopick.com/public_html/index.php on line 141
Warning: DOMDocument::loadHTML(): Unexpected end tag : a in Entity, line: 237 in /home/u552734802/domains/dailystocktopick.com/public_html/index.php on line 141
Warning: DOMDocument::loadHTML(): Unexpected end tag : a in Entity, line: 237 in /home/u552734802/domains/dailystocktopick.com/public_html/index.php on line 141
Warning: DOMDocument::loadHTML(): Unexpected end tag : a in Entity, line: 237 in /home/u552734802/domains/dailystocktopick.com/public_html/index.php on line 141
Warning: DOMDocument::loadHTML(): Unexpected end tag : a in Entity, line: 237 in /home/u552734802/domains/dailystocktopick.com/public_html/index.php on line 141
Warning: DOMDocument::loadHTML(): Unexpected end tag : a in Entity, line: 237 in /home/u552734802/domains/dailystocktopick.com/public_html/index.php on line 141
Warning: DOMDocument::loadHTML(): Unexpected end tag : a in Entity, line: 237 in /home/u552734802/domains/dailystocktopick.com/public_html/index.php on line 141
Warning: DOMDocument::loadHTML(): Unexpected end tag : a in Entity, line: 237 in /home/u552734802/domains/dailystocktopick.com/public_html/index.php on line 141
Warning: DOMDocument::loadHTML(): Unexpected end tag : a in Entity, line: 237 in /home/u552734802/domains/dailystocktopick.com/public_html/index.php on line 141
Warning: DOMDocument::loadHTML(): Unexpected end tag : a in Entity, line: 237 in /home/u552734802/domains/dailystocktopick.com/public_html/index.php on line 141
Warning: DOMDocument::loadHTML(): Unexpected end tag : a in Entity, line: 237 in /home/u552734802/domains/dailystocktopick.com/public_html/index.php on line 141
Warning: DOMDocument::loadHTML(): Unexpected end tag : a in Entity, line: 237 in /home/u552734802/domains/dailystocktopick.com/public_html/index.php on line 141
Warning: DOMDocument::loadHTML(): Unexpected end tag : a in Entity, line: 237 in /home/u552734802/domains/dailystocktopick.com/public_html/index.php on line 141
Warning: DOMDocument::loadHTML(): Unexpected end tag : div in Entity, line: 237 in /home/u552734802/domains/dailystocktopick.com/public_html/index.php on line 141
Warning: DOMDocument::loadHTML(): Unexpected end tag : li in Entity, line: 237 in /home/u552734802/domains/dailystocktopick.com/public_html/index.php on line 141
Warning: DOMDocument::loadHTML(): Unexpected end tag : div in Entity, line: 237 in /home/u552734802/domains/dailystocktopick.com/public_html/index.php on line 141
Warning: DOMDocument::loadHTML(): Unexpected end tag : a in Entity, line: 237 in /home/u552734802/domains/dailystocktopick.com/public_html/index.php on line 141
Warning: DOMDocument::loadHTML(): Unexpected end tag : a in Entity, line: 237 in /home/u552734802/domains/dailystocktopick.com/public_html/index.php on line 141
Warning: DOMDocument::loadHTML(): Unexpected end tag : a in Entity, line: 237 in /home/u552734802/domains/dailystocktopick.com/public_html/index.php on line 141
Warning: DOMDocument::loadHTML(): Unexpected end tag : a in Entity, line: 237 in /home/u552734802/domains/dailystocktopick.com/public_html/index.php on line 141
Warning: DOMDocument::loadHTML(): Unexpected end tag : a in Entity, line: 237 in /home/u552734802/domains/dailystocktopick.com/public_html/index.php on line 141
Warning: DOMDocument::loadHTML(): Unexpected end tag : a in Entity, line: 237 in /home/u552734802/domains/dailystocktopick.com/public_html/index.php on line 141
Warning: DOMDocument::loadHTML(): Unexpected end tag : a in Entity, line: 237 in /home/u552734802/domains/dailystocktopick.com/public_html/index.php on line 141
Warning: DOMDocument::loadHTML(): Unexpected end tag : a in Entity, line: 237 in /home/u552734802/domains/dailystocktopick.com/public_html/index.php on line 141
Warning: DOMDocument::loadHTML(): Unexpected end tag : a in Entity, line: 237 in /home/u552734802/domains/dailystocktopick.com/public_html/index.php on line 141
Warning: DOMDocument::loadHTML(): Unexpected end tag : a in Entity, line: 237 in /home/u552734802/domains/dailystocktopick.com/public_html/index.php on line 141
Warning: DOMDocument::loadHTML(): Unexpected end tag : a in Entity, line: 237 in /home/u552734802/domains/dailystocktopick.com/public_html/index.php on line 141
Warning: DOMDocument::loadHTML(): Unexpected end tag : a in Entity, line: 237 in /home/u552734802/domains/dailystocktopick.com/public_html/index.php on line 141
Warning: DOMDocument::loadHTML(): Unexpected end tag : a in Entity, line: 237 in /home/u552734802/domains/dailystocktopick.com/public_html/index.php on line 141
Warning: DOMDocument::loadHTML(): Unexpected end tag : div in Entity, line: 237 in /home/u552734802/domains/dailystocktopick.com/public_html/index.php on line 141
Warning: DOMDocument::loadHTML(): Unexpected end tag : li in Entity, line: 237 in /home/u552734802/domains/dailystocktopick.com/public_html/index.php on line 141
Warning: DOMDocument::loadHTML(): Unexpected end tag : div in Entity, line: 237 in /home/u552734802/domains/dailystocktopick.com/public_html/index.php on line 141
Warning: DOMDocument::loadHTML(): Unexpected end tag : a in Entity, line: 237 in /home/u552734802/domains/dailystocktopick.com/public_html/index.php on line 141
Warning: DOMDocument::loadHTML(): Unexpected end tag : a in Entity, line: 237 in /home/u552734802/domains/dailystocktopick.com/public_html/index.php on line 141
Warning: DOMDocument::loadHTML(): Unexpected end tag : a in Entity, line: 237 in /home/u552734802/domains/dailystocktopick.com/public_html/index.php on line 141
Warning: DOMDocument::loadHTML(): Unexpected end tag : a in Entity, line: 237 in /home/u552734802/domains/dailystocktopick.com/public_html/index.php on line 141
Warning: DOMDocument::loadHTML(): Unexpected end tag : a in Entity, line: 237 in /home/u552734802/domains/dailystocktopick.com/public_html/index.php on line 141
Warning: DOMDocument::loadHTML(): Unexpected end tag : a in Entity, line: 237 in /home/u552734802/domains/dailystocktopick.com/public_html/index.php on line 141
Warning: DOMDocument::loadHTML(): Unexpected end tag : a in Entity, line: 237 in /home/u552734802/domains/dailystocktopick.com/public_html/index.php on line 141
Warning: DOMDocument::loadHTML(): Unexpected end tag : a in Entity, line: 237 in /home/u552734802/domains/dailystocktopick.com/public_html/index.php on line 141
Warning: DOMDocument::loadHTML(): Unexpected end tag : a in Entity, line: 237 in /home/u552734802/domains/dailystocktopick.com/public_html/index.php on line 141
Warning: DOMDocument::loadHTML(): Unexpected end tag : a in Entity, line: 237 in /home/u552734802/domains/dailystocktopick.com/public_html/index.php on line 141
Warning: DOMDocument::loadHTML(): Unexpected end tag : a in Entity, line: 237 in /home/u552734802/domains/dailystocktopick.com/public_html/index.php on line 141
Warning: DOMDocument::loadHTML(): Unexpected end tag : a in Entity, line: 237 in /home/u552734802/domains/dailystocktopick.com/public_html/index.php on line 141
Warning: DOMDocument::loadHTML(): Unexpected end tag : a in Entity, line: 237 in /home/u552734802/domains/dailystocktopick.com/public_html/index.php on line 141
Warning: DOMDocument::loadHTML(): Unexpected end tag : a in Entity, line: 237 in /home/u552734802/domains/dailystocktopick.com/public_html/index.php on line 141
Warning: DOMDocument::loadHTML(): Unexpected end tag : a in Entity, line: 237 in /home/u552734802/domains/dailystocktopick.com/public_html/index.php on line 141
Warning: DOMDocument::loadHTML(): Unexpected end tag : div in Entity, line: 237 in /home/u552734802/domains/dailystocktopick.com/public_html/index.php on line 141
Warning: DOMDocument::loadHTML(): Unexpected end tag : li in Entity, line: 237 in /home/u552734802/domains/dailystocktopick.com/public_html/index.php on line 141
Warning: DOMDocument::loadHTML(): Unexpected end tag : div in Entity, line: 237 in /home/u552734802/domains/dailystocktopick.com/public_html/index.php on line 141
Warning: DOMDocument::loadHTML(): Unexpected end tag : a in Entity, line: 237 in /home/u552734802/domains/dailystocktopick.com/public_html/index.php on line 141
Warning: DOMDocument::loadHTML(): Unexpected end tag : a in Entity, line: 237 in /home/u552734802/domains/dailystocktopick.com/public_html/index.php on line 141
Warning: DOMDocument::loadHTML(): Unexpected end tag : a in Entity, line: 237 in /home/u552734802/domains/dailystocktopick.com/public_html/index.php on line 141
Warning: DOMDocument::loadHTML(): Unexpected end tag : a in Entity, line: 237 in /home/u552734802/domains/dailystocktopick.com/public_html/index.php on line 141
Warning: DOMDocument::loadHTML(): Unexpected end tag : a in Entity, line: 237 in /home/u552734802/domains/dailystocktopick.com/public_html/index.php on line 141
Warning: DOMDocument::loadHTML(): Unexpected end tag : a in Entity, line: 237 in /home/u552734802/domains/dailystocktopick.com/public_html/index.php on line 141
Warning: DOMDocument::loadHTML(): Unexpected end tag : a in Entity, line: 237 in /home/u552734802/domains/dailystocktopick.com/public_html/index.php on line 141
Warning: DOMDocument::loadHTML(): Unexpected end tag : a in Entity, line: 237 in /home/u552734802/domains/dailystocktopick.com/public_html/index.php on line 141
Warning: DOMDocument::loadHTML(): Unexpected end tag : a in Entity, line: 237 in /home/u552734802/domains/dailystocktopick.com/public_html/index.php on line 141
Warning: DOMDocument::loadHTML(): Unexpected end tag : a in Entity, line: 237 in /home/u552734802/domains/dailystocktopick.com/public_html/index.php on line 141
Warning: DOMDocument::loadHTML(): Unexpected end tag : div in Entity, line: 237 in /home/u552734802/domains/dailystocktopick.com/public_html/index.php on line 141
Warning: DOMDocument::loadHTML(): Unexpected end tag : li in Entity, line: 237 in /home/u552734802/domains/dailystocktopick.com/public_html/index.php on line 141
Warning: DOMDocument::loadHTML(): Unexpected end tag : div in Entity, line: 237 in /home/u552734802/domains/dailystocktopick.com/public_html/index.php on line 141
Warning: DOMDocument::loadHTML(): Unexpected end tag : a in Entity, line: 237 in /home/u552734802/domains/dailystocktopick.com/public_html/index.php on line 141
Warning: DOMDocument::loadHTML(): Unexpected end tag : a in Entity, line: 237 in /home/u552734802/domains/dailystocktopick.com/public_html/index.php on line 141
Warning: DOMDocument::loadHTML(): Unexpected end tag : a in Entity, line: 237 in /home/u552734802/domains/dailystocktopick.com/public_html/index.php on line 141
Warning: DOMDocument::loadHTML(): Unexpected end tag : a in Entity, line: 237 in /home/u552734802/domains/dailystocktopick.com/public_html/index.php on line 141
Warning: DOMDocument::loadHTML(): Unexpected end tag : a in Entity, line: 237 in /home/u552734802/domains/dailystocktopick.com/public_html/index.php on line 141
Warning: DOMDocument::loadHTML(): Unexpected end tag : a in Entity, line: 237 in /home/u552734802/domains/dailystocktopick.com/public_html/index.php on line 141
Warning: DOMDocument::loadHTML(): Unexpected end tag : a in Entity, line: 237 in /home/u552734802/domains/dailystocktopick.com/public_html/index.php on line 141
Warning: DOMDocument::loadHTML(): Unexpected end tag : a in Entity, line: 237 in /home/u552734802/domains/dailystocktopick.com/public_html/index.php on line 141
Warning: DOMDocument::loadHTML(): Unexpected end tag : a in Entity, line: 237 in /home/u552734802/domains/dailystocktopick.com/public_html/index.php on line 141
Warning: DOMDocument::loadHTML(): Unexpected end tag : a in Entity, line: 237 in /home/u552734802/domains/dailystocktopick.com/public_html/index.php on line 141
Warning: DOMDocument::loadHTML(): Unexpected end tag : a in Entity, line: 237 in /home/u552734802/domains/dailystocktopick.com/public_html/index.php on line 141
Warning: DOMDocument::loadHTML(): Unexpected end tag : a in Entity, line: 237 in /home/u552734802/domains/dailystocktopick.com/public_html/index.php on line 141
Warning: DOMDocument::loadHTML(): Unexpected end tag : a in Entity, line: 237 in /home/u552734802/domains/dailystocktopick.com/public_html/index.php on line 141
Warning: DOMDocument::loadHTML(): Unexpected end tag : a in Entity, line: 237 in /home/u552734802/domains/dailystocktopick.com/public_html/index.php on line 141
Warning: DOMDocument::loadHTML(): Unexpected end tag : a in Entity, line: 237 in /home/u552734802/domains/dailystocktopick.com/public_html/index.php on line 141
Warning: DOMDocument::loadHTML(): Unexpected end tag : a in Entity, line: 237 in /home/u552734802/domains/dailystocktopick.com/public_html/index.php on line 141
Warning: DOMDocument::loadHTML(): Unexpected end tag : a in Entity, line: 237 in /home/u552734802/domains/dailystocktopick.com/public_html/index.php on line 141
Warning: DOMDocument::loadHTML(): Unexpected end tag : a in Entity, line: 237 in /home/u552734802/domains/dailystocktopick.com/public_html/index.php on line 141
Warning: DOMDocument::loadHTML(): Unexpected end tag : a in Entity, line: 237 in /home/u552734802/domains/dailystocktopick.com/public_html/index.php on line 141
Warning: DOMDocument::loadHTML(): Unexpected end tag : div in Entity, line: 237 in /home/u552734802/domains/dailystocktopick.com/public_html/index.php on line 141
Warning: DOMDocument::loadHTML(): Unexpected end tag : li in Entity, line: 237 in /home/u552734802/domains/dailystocktopick.com/public_html/index.php on line 141
Warning: DOMDocument::loadHTML(): Unexpected end tag : div in Entity, line: 237 in /home/u552734802/domains/dailystocktopick.com/public_html/index.php on line 141
Warning: DOMDocument::loadHTML(): Unexpected end tag : a in Entity, line: 237 in /home/u552734802/domains/dailystocktopick.com/public_html/index.php on line 141
Warning: DOMDocument::loadHTML(): Unexpected end tag : a in Entity, line: 237 in /home/u552734802/domains/dailystocktopick.com/public_html/index.php on line 141
Warning: DOMDocument::loadHTML(): Unexpected end tag : a in Entity, line: 237 in /home/u552734802/domains/dailystocktopick.com/public_html/index.php on line 141
Warning: DOMDocument::loadHTML(): Unexpected end tag : a in Entity, line: 237 in /home/u552734802/domains/dailystocktopick.com/public_html/index.php on line 141
Warning: DOMDocument::loadHTML(): Unexpected end tag : a in Entity, line: 237 in /home/u552734802/domains/dailystocktopick.com/public_html/index.php on line 141
Warning: DOMDocument::loadHTML(): Unexpected end tag : a in Entity, line: 237 in /home/u552734802/domains/dailystocktopick.com/public_html/index.php on line 141
Warning: DOMDocument::loadHTML(): Unexpected end tag : a in Entity, line: 237 in /home/u552734802/domains/dailystocktopick.com/public_html/index.php on line 141
Warning: DOMDocument::loadHTML(): Unexpected end tag : a in Entity, line: 237 in /home/u552734802/domains/dailystocktopick.com/public_html/index.php on line 141
Warning: DOMDocument::loadHTML(): Unexpected end tag : a in Entity, line: 237 in /home/u552734802/domains/dailystocktopick.com/public_html/index.php on line 141
Warning: DOMDocument::loadHTML(): Unexpected end tag : a in Entity, line: 237 in /home/u552734802/domains/dailystocktopick.com/public_html/index.php on line 141
Warning: DOMDocument::loadHTML(): Unexpected end tag : a in Entity, line: 237 in /home/u552734802/domains/dailystocktopick.com/public_html/index.php on line 141
Warning: DOMDocument::loadHTML(): Unexpected end tag : a in Entity, line: 237 in /home/u552734802/domains/dailystocktopick.com/public_html/index.php on line 141
Warning: DOMDocument::loadHTML(): Unexpected end tag : a in Entity, line: 237 in /home/u552734802/domains/dailystocktopick.com/public_html/index.php on line 141
Warning: DOMDocument::loadHTML(): Unexpected end tag : div in Entity, line: 237 in /home/u552734802/domains/dailystocktopick.com/public_html/index.php on line 141
Warning: DOMDocument::loadHTML(): Unexpected end tag : li in Entity, line: 237 in /home/u552734802/domains/dailystocktopick.com/public_html/index.php on line 141
Warning: DOMDocument::loadHTML(): Unexpected end tag : div in Entity, line: 237 in /home/u552734802/domains/dailystocktopick.com/public_html/index.php on line 141
Warning: DOMDocument::loadHTML(): Unexpected end tag : a in Entity, line: 237 in /home/u552734802/domains/dailystocktopick.com/public_html/index.php on line 141
Warning: DOMDocument::loadHTML(): Unexpected end tag : a in Entity, line: 237 in /home/u552734802/domains/dailystocktopick.com/public_html/index.php on line 141
Warning: DOMDocument::loadHTML(): Unexpected end tag : a in Entity, line: 237 in /home/u552734802/domains/dailystocktopick.com/public_html/index.php on line 141
Warning: DOMDocument::loadHTML(): Unexpected end tag : a in Entity, line: 237 in /home/u552734802/domains/dailystocktopick.com/public_html/index.php on line 141
Warning: DOMDocument::loadHTML(): Unexpected end tag : a in Entity, line: 237 in /home/u552734802/domains/dailystocktopick.com/public_html/index.php on line 141
Warning: DOMDocument::loadHTML(): Unexpected end tag : a in Entity, line: 237 in /home/u552734802/domains/dailystocktopick.com/public_html/index.php on line 141
Warning: DOMDocument::loadHTML(): Unexpected end tag : a in Entity, line: 237 in /home/u552734802/domains/dailystocktopick.com/public_html/index.php on line 141
Warning: DOMDocument::loadHTML(): Unexpected end tag : a in Entity, line: 237 in /home/u552734802/domains/dailystocktopick.com/public_html/index.php on line 141
Warning: DOMDocument::loadHTML(): Unexpected end tag : div in Entity, line: 237 in /home/u552734802/domains/dailystocktopick.com/public_html/index.php on line 141
Warning: DOMDocument::loadHTML(): Unexpected end tag : li in Entity, line: 237 in /home/u552734802/domains/dailystocktopick.com/public_html/index.php on line 141
Warning: DOMDocument::loadHTML(): Unexpected end tag : div in Entity, line: 237 in /home/u552734802/domains/dailystocktopick.com/public_html/index.php on line 141
Warning: DOMDocument::loadHTML(): Unexpected end tag : a in Entity, line: 237 in /home/u552734802/domains/dailystocktopick.com/public_html/index.php on line 141
Warning: DOMDocument::loadHTML(): Unexpected end tag : a in Entity, line: 237 in /home/u552734802/domains/dailystocktopick.com/public_html/index.php on line 141
Warning: DOMDocument::loadHTML(): Unexpected end tag : a in Entity, line: 237 in /home/u552734802/domains/dailystocktopick.com/public_html/index.php on line 141
Warning: DOMDocument::loadHTML(): Unexpected end tag : a in Entity, line: 237 in /home/u552734802/domains/dailystocktopick.com/public_html/index.php on line 141
Warning: DOMDocument::loadHTML(): Unexpected end tag : a in Entity, line: 237 in /home/u552734802/domains/dailystocktopick.com/public_html/index.php on line 141
Warning: DOMDocument::loadHTML(): Unexpected end tag : a in Entity, line: 237 in /home/u552734802/domains/dailystocktopick.com/public_html/index.php on line 141
Warning: DOMDocument::loadHTML(): Unexpected end tag : a in Entity, line: 237 in /home/u552734802/domains/dailystocktopick.com/public_html/index.php on line 141
Warning: DOMDocument::loadHTML(): Unexpected end tag : a in Entity, line: 237 in /home/u552734802/domains/dailystocktopick.com/public_html/index.php on line 141
Warning: DOMDocument::loadHTML(): Unexpected end tag : a in Entity, line: 237 in /home/u552734802/domains/dailystocktopick.com/public_html/index.php on line 141
Warning: DOMDocument::loadHTML(): Unexpected end tag : a in Entity, line: 237 in /home/u552734802/domains/dailystocktopick.com/public_html/index.php on line 141
Warning: DOMDocument::loadHTML(): Unexpected end tag : a in Entity, line: 237 in /home/u552734802/domains/dailystocktopick.com/public_html/index.php on line 141
Warning: DOMDocument::loadHTML(): Unexpected end tag : a in Entity, line: 237 in /home/u552734802/domains/dailystocktopick.com/public_html/index.php on line 141
Warning: DOMDocument::loadHTML(): Unexpected end tag : a in Entity, line: 237 in /home/u552734802/domains/dailystocktopick.com/public_html/index.php on line 141
Warning: DOMDocument::loadHTML(): Unexpected end tag : a in Entity, line: 237 in /home/u552734802/domains/dailystocktopick.com/public_html/index.php on line 141
Warning: DOMDocument::loadHTML(): Unexpected end tag : a in Entity, line: 237 in /home/u552734802/domains/dailystocktopick.com/public_html/index.php on line 141
Warning: DOMDocument::loadHTML(): Unexpected end tag : a in Entity, line: 237 in /home/u552734802/domains/dailystocktopick.com/public_html/index.php on line 141
Warning: DOMDocument::loadHTML(): Unexpected end tag : div in Entity, line: 237 in /home/u552734802/domains/dailystocktopick.com/public_html/index.php on line 141
Warning: DOMDocument::loadHTML(): Unexpected end tag : li in Entity, line: 237 in /home/u552734802/domains/dailystocktopick.com/public_html/index.php on line 141
Warning: DOMDocument::loadHTML(): Unexpected end tag : div in Entity, line: 237 in /home/u552734802/domains/dailystocktopick.com/public_html/index.php on line 141
Warning: DOMDocument::loadHTML(): Unexpected end tag : a in Entity, line: 237 in /home/u552734802/domains/dailystocktopick.com/public_html/index.php on line 141
Warning: DOMDocument::loadHTML(): Unexpected end tag : a in Entity, line: 237 in /home/u552734802/domains/dailystocktopick.com/public_html/index.php on line 141
Warning: DOMDocument::loadHTML(): Unexpected end tag : a in Entity, line: 237 in /home/u552734802/domains/dailystocktopick.com/public_html/index.php on line 141
Warning: DOMDocument::loadHTML(): Unexpected end tag : a in Entity, line: 237 in /home/u552734802/domains/dailystocktopick.com/public_html/index.php on line 141
Warning: DOMDocument::loadHTML(): Unexpected end tag : a in Entity, line: 237 in /home/u552734802/domains/dailystocktopick.com/public_html/index.php on line 141
Warning: DOMDocument::loadHTML(): Unexpected end tag : a in Entity, line: 237 in /home/u552734802/domains/dailystocktopick.com/public_html/index.php on line 141
Warning: DOMDocument::loadHTML(): Unexpected end tag : a in Entity, line: 237 in /home/u552734802/domains/dailystocktopick.com/public_html/index.php on line 141
Warning: DOMDocument::loadHTML(): Unexpected end tag : a in Entity, line: 237 in /home/u552734802/domains/dailystocktopick.com/public_html/index.php on line 141
Warning: DOMDocument::loadHTML(): Unexpected end tag : a in Entity, line: 237 in /home/u552734802/domains/dailystocktopick.com/public_html/index.php on line 141
Warning: DOMDocument::loadHTML(): Unexpected end tag : a in Entity, line: 237 in /home/u552734802/domains/dailystocktopick.com/public_html/index.php on line 141
Warning: DOMDocument::loadHTML(): Unexpected end tag : a in Entity, line: 237 in /home/u552734802/domains/dailystocktopick.com/public_html/index.php on line 141
Warning: DOMDocument::loadHTML(): Unexpected end tag : a in Entity, line: 237 in /home/u552734802/domains/dailystocktopick.com/public_html/index.php on line 141
Warning: DOMDocument::loadHTML(): Unexpected end tag : a in Entity, line: 237 in /home/u552734802/domains/dailystocktopick.com/public_html/index.php on line 141
Warning: DOMDocument::loadHTML(): Unexpected end tag : a in Entity, line: 237 in /home/u552734802/domains/dailystocktopick.com/public_html/index.php on line 141
Warning: DOMDocument::loadHTML(): Unexpected end tag : a in Entity, line: 237 in /home/u552734802/domains/dailystocktopick.com/public_html/index.php on line 141
Warning: DOMDocument::loadHTML(): Unexpected end tag : div in Entity, line: 237 in /home/u552734802/domains/dailystocktopick.com/public_html/index.php on line 141
Warning: DOMDocument::loadHTML(): Unexpected end tag : li in Entity, line: 237 in /home/u552734802/domains/dailystocktopick.com/public_html/index.php on line 141
Warning: DOMDocument::loadHTML(): Unexpected end tag : div in Entity, line: 237 in /home/u552734802/domains/dailystocktopick.com/public_html/index.php on line 141
Warning: DOMDocument::loadHTML(): Unexpected end tag : a in Entity, line: 237 in /home/u552734802/domains/dailystocktopick.com/public_html/index.php on line 141
Warning: DOMDocument::loadHTML(): Unexpected end tag : a in Entity, line: 237 in /home/u552734802/domains/dailystocktopick.com/public_html/index.php on line 141
Warning: DOMDocument::loadHTML(): Unexpected end tag : a in Entity, line: 237 in /home/u552734802/domains/dailystocktopick.com/public_html/index.php on line 141
Warning: DOMDocument::loadHTML(): Unexpected end tag : a in Entity, line: 237 in /home/u552734802/domains/dailystocktopick.com/public_html/index.php on line 141
Warning: DOMDocument::loadHTML(): Unexpected end tag : a in Entity, line: 237 in /home/u552734802/domains/dailystocktopick.com/public_html/index.php on line 141
Warning: DOMDocument::loadHTML(): Unexpected end tag : a in Entity, line: 237 in /home/u552734802/domains/dailystocktopick.com/public_html/index.php on line 141
Warning: DOMDocument::loadHTML(): Unexpected end tag : a in Entity, line: 237 in /home/u552734802/domains/dailystocktopick.com/public_html/index.php on line 141
Warning: DOMDocument::loadHTML(): Unexpected end tag : a in Entity, line: 237 in /home/u552734802/domains/dailystocktopick.com/public_html/index.php on line 141
Warning: DOMDocument::loadHTML(): Unexpected end tag : a in Entity, line: 237 in /home/u552734802/domains/dailystocktopick.com/public_html/index.php on line 141
Warning: DOMDocument::loadHTML(): Unexpected end tag : a in Entity, line: 237 in /home/u552734802/domains/dailystocktopick.com/public_html/index.php on line 141
Warning: DOMDocument::loadHTML(): Unexpected end tag : a in Entity, line: 237 in /home/u552734802/domains/dailystocktopick.com/public_html/index.php on line 141
Warning: DOMDocument::loadHTML(): Unexpected end tag : a in Entity, line: 237 in /home/u552734802/domains/dailystocktopick.com/public_html/index.php on line 141
Warning: DOMDocument::loadHTML(): Unexpected end tag : a in Entity, line: 237 in /home/u552734802/domains/dailystocktopick.com/public_html/index.php on line 141
Warning: DOMDocument::loadHTML(): Unexpected end tag : a in Entity, line: 237 in /home/u552734802/domains/dailystocktopick.com/public_html/index.php on line 141
Warning: DOMDocument::loadHTML(): Unexpected end tag : a in Entity, line: 237 in /home/u552734802/domains/dailystocktopick.com/public_html/index.php on line 141
Warning: DOMDocument::loadHTML(): Unexpected end tag : a in Entity, line: 237 in /home/u552734802/domains/dailystocktopick.com/public_html/index.php on line 141
Warning: DOMDocument::loadHTML(): Unexpected end tag : a in Entity, line: 237 in /home/u552734802/domains/dailystocktopick.com/public_html/index.php on line 141
Warning: DOMDocument::loadHTML(): Unexpected end tag : div in Entity, line: 237 in /home/u552734802/domains/dailystocktopick.com/public_html/index.php on line 141
Warning: DOMDocument::loadHTML(): Unexpected end tag : li in Entity, line: 237 in /home/u552734802/domains/dailystocktopick.com/public_html/index.php on line 141
Warning: DOMDocument::loadHTML(): Unexpected end tag : div in Entity, line: 237 in /home/u552734802/domains/dailystocktopick.com/public_html/index.php on line 141
Warning: DOMDocument::loadHTML(): Unexpected end tag : a in Entity, line: 237 in /home/u552734802/domains/dailystocktopick.com/public_html/index.php on line 141
Warning: DOMDocument::loadHTML(): Unexpected end tag : a in Entity, line: 237 in /home/u552734802/domains/dailystocktopick.com/public_html/index.php on line 141
Warning: DOMDocument::loadHTML(): Unexpected end tag : a in Entity, line: 237 in /home/u552734802/domains/dailystocktopick.com/public_html/index.php on line 141
Warning: DOMDocument::loadHTML(): Unexpected end tag : a in Entity, line: 237 in /home/u552734802/domains/dailystocktopick.com/public_html/index.php on line 141
Warning: DOMDocument::loadHTML(): Unexpected end tag : a in Entity, line: 237 in /home/u552734802/domains/dailystocktopick.com/public_html/index.php on line 141
Warning: DOMDocument::loadHTML(): Unexpected end tag : a in Entity, line: 237 in /home/u552734802/domains/dailystocktopick.com/public_html/index.php on line 141
Warning: DOMDocument::loadHTML(): Unexpected end tag : a in Entity, line: 237 in /home/u552734802/domains/dailystocktopick.com/public_html/index.php on line 141
Warning: DOMDocument::loadHTML(): Unexpected end tag : a in Entity, line: 237 in /home/u552734802/domains/dailystocktopick.com/public_html/index.php on line 141
Warning: DOMDocument::loadHTML(): Unexpected end tag : a in Entity, line: 237 in /home/u552734802/domains/dailystocktopick.com/public_html/index.php on line 141
Warning: DOMDocument::loadHTML(): Unexpected end tag : a in Entity, line: 237 in /home/u552734802/domains/dailystocktopick.com/public_html/index.php on line 141
Warning: DOMDocument::loadHTML(): Unexpected end tag : a in Entity, line: 237 in /home/u552734802/domains/dailystocktopick.com/public_html/index.php on line 141
Warning: DOMDocument::loadHTML(): Unexpected end tag : a in Entity, line: 237 in /home/u552734802/domains/dailystocktopick.com/public_html/index.php on line 141
Warning: DOMDocument::loadHTML(): Unexpected end tag : a in Entity, line: 237 in /home/u552734802/domains/dailystocktopick.com/public_html/index.php on line 141
Warning: DOMDocument::loadHTML(): Unexpected end tag : div in Entity, line: 237 in /home/u552734802/domains/dailystocktopick.com/public_html/index.php on line 141
Warning: DOMDocument::loadHTML(): Unexpected end tag : li in Entity, line: 237 in /home/u552734802/domains/dailystocktopick.com/public_html/index.php on line 141
Warning: DOMDocument::loadHTML(): Unexpected end tag : ul in Entity, line: 237 in /home/u552734802/domains/dailystocktopick.com/public_html/index.php on line 141
Warning: DOMDocument::loadHTML(): Unexpected end tag : h2 in Entity, line: 252 in /home/u552734802/domains/dailystocktopick.com/public_html/index.php on line 141
Warning: DOMDocument::loadHTML(): Unexpected end tag : p in Entity, line: 253 in /home/u552734802/domains/dailystocktopick.com/public_html/index.php on line 141
Warning: DOMDocument::loadHTML(): Unexpected end tag : button in Entity, line: 256 in /home/u552734802/domains/dailystocktopick.com/public_html/index.php on line 141
Warning: DOMDocument::loadHTML(): Unexpected end tag : div in Entity, line: 257 in /home/u552734802/domains/dailystocktopick.com/public_html/index.php on line 141
Warning: DOMDocument::loadHTML(): Unexpected end tag : i in Entity, line: 237 in /home/u552734802/domains/dailystocktopick.com/public_html/index.php on line 141
Warning: DOMDocument::loadHTML(): Unexpected end tag : span in Entity, line: 237 in /home/u552734802/domains/dailystocktopick.com/public_html/index.php on line 141
Warning: DOMDocument::loadHTML(): Unexpected end tag : div in Entity, line: 237 in /home/u552734802/domains/dailystocktopick.com/public_html/index.php on line 141
Warning: DOMDocument::loadHTML(): Unexpected end tag : div in Entity, line: 237 in /home/u552734802/domains/dailystocktopick.com/public_html/index.php on line 141
Warning: DOMDocument::loadHTML(): Unexpected end tag : a in Entity, line: 237 in /home/u552734802/domains/dailystocktopick.com/public_html/index.php on line 141
Warning: DOMDocument::loadHTML(): Unexpected end tag : a in Entity, line: 237 in /home/u552734802/domains/dailystocktopick.com/public_html/index.php on line 141
Warning: DOMDocument::loadHTML(): Unexpected end tag : a in Entity, line: 237 in /home/u552734802/domains/dailystocktopick.com/public_html/index.php on line 141
Warning: DOMDocument::loadHTML(): Unexpected end tag : a in Entity, line: 237 in /home/u552734802/domains/dailystocktopick.com/public_html/index.php on line 141
Warning: DOMDocument::loadHTML(): Unexpected end tag : a in Entity, line: 237 in /home/u552734802/domains/dailystocktopick.com/public_html/index.php on line 141
Warning: DOMDocument::loadHTML(): Unexpected end tag : a in Entity, line: 237 in /home/u552734802/domains/dailystocktopick.com/public_html/index.php on line 141
Warning: DOMDocument::loadHTML(): Unexpected end tag : a in Entity, line: 237 in /home/u552734802/domains/dailystocktopick.com/public_html/index.php on line 141
Warning: DOMDocument::loadHTML(): Unexpected end tag : a in Entity, line: 237 in /home/u552734802/domains/dailystocktopick.com/public_html/index.php on line 141
Warning: DOMDocument::loadHTML(): Unexpected end tag : a in Entity, line: 237 in /home/u552734802/domains/dailystocktopick.com/public_html/index.php on line 141
Warning: DOMDocument::loadHTML(): Unexpected end tag : a in Entity, line: 237 in /home/u552734802/domains/dailystocktopick.com/public_html/index.php on line 141
Warning: DOMDocument::loadHTML(): Unexpected end tag : a in Entity, line: 237 in /home/u552734802/domains/dailystocktopick.com/public_html/index.php on line 141
Warning: DOMDocument::loadHTML(): Unexpected end tag : div in Entity, line: 237 in /home/u552734802/domains/dailystocktopick.com/public_html/index.php on line 141
Warning: DOMDocument::loadHTML(): Unexpected end tag : li in Entity, line: 237 in /home/u552734802/domains/dailystocktopick.com/public_html/index.php on line 141
Warning: DOMDocument::loadHTML(): Unexpected end tag : div in Entity, line: 237 in /home/u552734802/domains/dailystocktopick.com/public_html/index.php on line 141
Warning: DOMDocument::loadHTML(): Unexpected end tag : a in Entity, line: 237 in /home/u552734802/domains/dailystocktopick.com/public_html/index.php on line 141
Warning: DOMDocument::loadHTML(): Unexpected end tag : a in Entity, line: 237 in /home/u552734802/domains/dailystocktopick.com/public_html/index.php on line 141
Warning: DOMDocument::loadHTML(): Unexpected end tag : a in Entity, line: 237 in /home/u552734802/domains/dailystocktopick.com/public_html/index.php on line 141
Warning: DOMDocument::loadHTML(): Unexpected end tag : a in Entity, line: 237 in /home/u552734802/domains/dailystocktopick.com/public_html/index.php on line 141
Warning: DOMDocument::loadHTML(): Unexpected end tag : a in Entity, line: 237 in /home/u552734802/domains/dailystocktopick.com/public_html/index.php on line 141
Warning: DOMDocument::loadHTML(): Unexpected end tag : a in Entity, line: 237 in /home/u552734802/domains/dailystocktopick.com/public_html/index.php on line 141
Warning: DOMDocument::loadHTML(): Unexpected end tag : a in Entity, line: 237 in /home/u552734802/domains/dailystocktopick.com/public_html/index.php on line 141
Warning: DOMDocument::loadHTML(): Unexpected end tag : a in Entity, line: 237 in /home/u552734802/domains/dailystocktopick.com/public_html/index.php on line 141
Warning: DOMDocument::loadHTML(): Unexpected end tag : a in Entity, line: 237 in /home/u552734802/domains/dailystocktopick.com/public_html/index.php on line 141
Warning: DOMDocument::loadHTML(): Unexpected end tag : a in Entity, line: 237 in /home/u552734802/domains/dailystocktopick.com/public_html/index.php on line 141
Warning: DOMDocument::loadHTML(): Unexpected end tag : a in Entity, line: 237 in /home/u552734802/domains/dailystocktopick.com/public_html/index.php on line 141
Warning: DOMDocument::loadHTML(): Unexpected end tag : a in Entity, line: 237 in /home/u552734802/domains/dailystocktopick.com/public_html/index.php on line 141
Warning: DOMDocument::loadHTML(): Unexpected end tag : div in Entity, line: 237 in /home/u552734802/domains/dailystocktopick.com/public_html/index.php on line 141
Warning: DOMDocument::loadHTML(): Unexpected end tag : li in Entity, line: 237 in /home/u552734802/domains/dailystocktopick.com/public_html/index.php on line 141
Warning: DOMDocument::loadHTML(): Unexpected end tag : div in Entity, line: 237 in /home/u552734802/domains/dailystocktopick.com/public_html/index.php on line 141
Warning: DOMDocument::loadHTML(): Unexpected end tag : a in Entity, line: 237 in /home/u552734802/domains/dailystocktopick.com/public_html/index.php on line 141
Warning: DOMDocument::loadHTML(): Unexpected end tag : a in Entity, line: 237 in /home/u552734802/domains/dailystocktopick.com/public_html/index.php on line 141
Warning: DOMDocument::loadHTML(): Unexpected end tag : a in Entity, line: 237 in /home/u552734802/domains/dailystocktopick.com/public_html/index.php on line 141
Warning: DOMDocument::loadHTML(): Unexpected end tag : a in Entity, line: 237 in /home/u552734802/domains/dailystocktopick.com/public_html/index.php on line 141
Warning: DOMDocument::loadHTML(): Unexpected end tag : a in Entity, line: 237 in /home/u552734802/domains/dailystocktopick.com/public_html/index.php on line 141
Warning: DOMDocument::loadHTML(): Unexpected end tag : a in Entity, line: 237 in /home/u552734802/domains/dailystocktopick.com/public_html/index.php on line 141
Warning: DOMDocument::loadHTML(): Unexpected end tag : a in Entity, line: 237 in /home/u552734802/domains/dailystocktopick.com/public_html/index.php on line 141
Warning: DOMDocument::loadHTML(): Unexpected end tag : a in Entity, line: 237 in /home/u552734802/domains/dailystocktopick.com/public_html/index.php on line 141
Warning: DOMDocument::loadHTML(): Unexpected end tag : div in Entity, line: 237 in /home/u552734802/domains/dailystocktopick.com/public_html/index.php on line 141
Warning: DOMDocument::loadHTML(): Unexpected end tag : li in Entity, line: 237 in /home/u552734802/domains/dailystocktopick.com/public_html/index.php on line 141
Warning: DOMDocument::loadHTML(): Unexpected end tag : div in Entity, line: 237 in /home/u552734802/domains/dailystocktopick.com/public_html/index.php on line 141
Warning: DOMDocument::loadHTML(): Unexpected end tag : a in Entity, line: 237 in /home/u552734802/domains/dailystocktopick.com/public_html/index.php on line 141
Warning: DOMDocument::loadHTML(): Unexpected end tag : a in Entity, line: 237 in /home/u552734802/domains/dailystocktopick.com/public_html/index.php on line 141
Warning: DOMDocument::loadHTML(): Unexpected end tag : a in Entity, line: 237 in /home/u552734802/domains/dailystocktopick.com/public_html/index.php on line 141
Warning: DOMDocument::loadHTML(): Unexpected end tag : a in Entity, line: 237 in /home/u552734802/domains/dailystocktopick.com/public_html/index.php on line 141
Warning: DOMDocument::loadHTML(): Unexpected end tag : a in Entity, line: 237 in /home/u552734802/domains/dailystocktopick.com/public_html/index.php on line 141
Warning: DOMDocument::loadHTML(): Unexpected end tag : a in Entity, line: 237 in /home/u552734802/domains/dailystocktopick.com/public_html/index.php on line 141
Warning: DOMDocument::loadHTML(): Unexpected end tag : a in Entity, line: 237 in /home/u552734802/domains/dailystocktopick.com/public_html/index.php on line 141
Warning: DOMDocument::loadHTML(): Unexpected end tag : a in Entity, line: 237 in /home/u552734802/domains/dailystocktopick.com/public_html/index.php on line 141
Warning: DOMDocument::loadHTML(): Unexpected end tag : a in Entity, line: 237 in /home/u552734802/domains/dailystocktopick.com/public_html/index.php on line 141
Warning: DOMDocument::loadHTML(): Unexpected end tag : a in Entity, line: 237 in /home/u552734802/domains/dailystocktopick.com/public_html/index.php on line 141
Warning: DOMDocument::loadHTML(): Unexpected end tag : a in Entity, line: 237 in /home/u552734802/domains/dailystocktopick.com/public_html/index.php on line 141
Warning: DOMDocument::loadHTML(): Unexpected end tag : a in Entity, line: 237 in /home/u552734802/domains/dailystocktopick.com/public_html/index.php on line 141
Warning: DOMDocument::loadHTML(): Unexpected end tag : div in Entity, line: 237 in /home/u552734802/domains/dailystocktopick.com/public_html/index.php on line 141
Warning: DOMDocument::loadHTML(): Unexpected end tag : li in Entity, line: 237 in /home/u552734802/domains/dailystocktopick.com/public_html/index.php on line 141
Warning: DOMDocument::loadHTML(): Unexpected end tag : div in Entity, line: 237 in /home/u552734802/domains/dailystocktopick.com/public_html/index.php on line 141
Warning: DOMDocument::loadHTML(): Unexpected end tag : a in Entity, line: 237 in /home/u552734802/domains/dailystocktopick.com/public_html/index.php on line 141
Warning: DOMDocument::loadHTML(): Unexpected end tag : a in Entity, line: 237 in /home/u552734802/domains/dailystocktopick.com/public_html/index.php on line 141
Warning: DOMDocument::loadHTML(): Unexpected end tag : a in Entity, line: 237 in /home/u552734802/domains/dailystocktopick.com/public_html/index.php on line 141
Warning: DOMDocument::loadHTML(): Unexpected end tag : a in Entity, line: 237 in /home/u552734802/domains/dailystocktopick.com/public_html/index.php on line 141
Warning: DOMDocument::loadHTML(): Unexpected end tag : a in Entity, line: 237 in /home/u552734802/domains/dailystocktopick.com/public_html/index.php on line 141
Warning: DOMDocument::loadHTML(): Unexpected end tag : a in Entity, line: 237 in /home/u552734802/domains/dailystocktopick.com/public_html/index.php on line 141
Warning: DOMDocument::loadHTML(): Unexpected end tag : div in Entity, line: 237 in /home/u552734802/domains/dailystocktopick.com/public_html/index.php on line 141
Warning: DOMDocument::loadHTML(): Unexpected end tag : li in Entity, line: 237 in /home/u552734802/domains/dailystocktopick.com/public_html/index.php on line 141
Warning: DOMDocument::loadHTML(): Unexpected end tag : div in Entity, line: 237 in /home/u552734802/domains/dailystocktopick.com/public_html/index.php on line 141
Warning: DOMDocument::loadHTML(): Unexpected end tag : a in Entity, line: 237 in /home/u552734802/domains/dailystocktopick.com/public_html/index.php on line 141
Warning: DOMDocument::loadHTML(): Unexpected end tag : a in Entity, line: 237 in /home/u552734802/domains/dailystocktopick.com/public_html/index.php on line 141
Warning: DOMDocument::loadHTML(): Unexpected end tag : a in Entity, line: 237 in /home/u552734802/domains/dailystocktopick.com/public_html/index.php on line 141
Warning: DOMDocument::loadHTML(): Unexpected end tag : a in Entity, line: 237 in /home/u552734802/domains/dailystocktopick.com/public_html/index.php on line 141
Warning: DOMDocument::loadHTML(): Unexpected end tag : a in Entity, line: 237 in /home/u552734802/domains/dailystocktopick.com/public_html/index.php on line 141
Warning: DOMDocument::loadHTML(): Unexpected end tag : a in Entity, line: 237 in /home/u552734802/domains/dailystocktopick.com/public_html/index.php on line 141
Warning: DOMDocument::loadHTML(): Unexpected end tag : a in Entity, line: 237 in /home/u552734802/domains/dailystocktopick.com/public_html/index.php on line 141
Warning: DOMDocument::loadHTML(): Unexpected end tag : a in Entity, line: 237 in /home/u552734802/domains/dailystocktopick.com/public_html/index.php on line 141
Warning: DOMDocument::loadHTML(): Unexpected end tag : a in Entity, line: 237 in /home/u552734802/domains/dailystocktopick.com/public_html/index.php on line 141
Warning: DOMDocument::loadHTML(): Unexpected end tag : a in Entity, line: 237 in /home/u552734802/domains/dailystocktopick.com/public_html/index.php on line 141
Warning: DOMDocument::loadHTML(): Unexpected end tag : a in Entity, line: 237 in /home/u552734802/domains/dailystocktopick.com/public_html/index.php on line 141
Warning: DOMDocument::loadHTML(): Unexpected end tag : a in Entity, line: 237 in /home/u552734802/domains/dailystocktopick.com/public_html/index.php on line 141
Warning: DOMDocument::loadHTML(): Unexpected end tag : a in Entity, line: 237 in /home/u552734802/domains/dailystocktopick.com/public_html/index.php on line 141
Warning: DOMDocument::loadHTML(): Unexpected end tag : a in Entity, line: 237 in /home/u552734802/domains/dailystocktopick.com/public_html/index.php on line 141
Warning: DOMDocument::loadHTML(): Unexpected end tag : a in Entity, line: 237 in /home/u552734802/domains/dailystocktopick.com/public_html/index.php on line 141
Warning: DOMDocument::loadHTML(): Unexpected end tag : a in Entity, line: 237 in /home/u552734802/domains/dailystocktopick.com/public_html/index.php on line 141
Warning: DOMDocument::loadHTML(): Unexpected end tag : a in Entity, line: 237 in /home/u552734802/domains/dailystocktopick.com/public_html/index.php on line 141
Warning: DOMDocument::loadHTML(): Unexpected end tag : a in Entity, line: 237 in /home/u552734802/domains/dailystocktopick.com/public_html/index.php on line 141
Warning: DOMDocument::loadHTML(): Unexpected end tag : div in Entity, line: 237 in /home/u552734802/domains/dailystocktopick.com/public_html/index.php on line 141
Warning: DOMDocument::loadHTML(): Unexpected end tag : li in Entity, line: 237 in /home/u552734802/domains/dailystocktopick.com/public_html/index.php on line 141
Warning: DOMDocument::loadHTML(): Unexpected end tag : div in Entity, line: 237 in /home/u552734802/domains/dailystocktopick.com/public_html/index.php on line 141
Warning: DOMDocument::loadHTML(): Unexpected end tag : a in Entity, line: 237 in /home/u552734802/domains/dailystocktopick.com/public_html/index.php on line 141
Warning: DOMDocument::loadHTML(): Unexpected end tag : a in Entity, line: 237 in /home/u552734802/domains/dailystocktopick.com/public_html/index.php on line 141
Warning: DOMDocument::loadHTML(): Unexpected end tag : a in Entity, line: 237 in /home/u552734802/domains/dailystocktopick.com/public_html/index.php on line 141
Warning: DOMDocument::loadHTML(): Unexpected end tag : a in Entity, line: 237 in /home/u552734802/domains/dailystocktopick.com/public_html/index.php on line 141
Warning: DOMDocument::loadHTML(): Unexpected end tag : a in Entity, line: 237 in /home/u552734802/domains/dailystocktopick.com/public_html/index.php on line 141
Warning: DOMDocument::loadHTML(): Unexpected end tag : a in Entity, line: 237 in /home/u552734802/domains/dailystocktopick.com/public_html/index.php on line 141
Warning: DOMDocument::loadHTML(): Unexpected end tag : a in Entity, line: 237 in /home/u552734802/domains/dailystocktopick.com/public_html/index.php on line 141
Warning: DOMDocument::loadHTML(): Unexpected end tag : a in Entity, line: 237 in /home/u552734802/domains/dailystocktopick.com/public_html/index.php on line 141
Warning: DOMDocument::loadHTML(): Unexpected end tag : a in Entity, line: 237 in /home/u552734802/domains/dailystocktopick.com/public_html/index.php on line 141
Warning: DOMDocument::loadHTML(): Unexpected end tag : a in Entity, line: 237 in /home/u552734802/domains/dailystocktopick.com/public_html/index.php on line 141
Warning: DOMDocument::loadHTML(): Unexpected end tag : a in Entity, line: 237 in /home/u552734802/domains/dailystocktopick.com/public_html/index.php on line 141
Warning: DOMDocument::loadHTML(): Unexpected end tag : a in Entity, line: 237 in /home/u552734802/domains/dailystocktopick.com/public_html/index.php on line 141
Warning: DOMDocument::loadHTML(): Unexpected end tag : a in Entity, line: 237 in /home/u552734802/domains/dailystocktopick.com/public_html/index.php on line 141
Warning: DOMDocument::loadHTML(): Unexpected end tag : a in Entity, line: 237 in /home/u552734802/domains/dailystocktopick.com/public_html/index.php on line 141
Warning: DOMDocument::loadHTML(): Unexpected end tag : a in Entity, line: 237 in /home/u552734802/domains/dailystocktopick.com/public_html/index.php on line 141
Warning: DOMDocument::loadHTML(): Unexpected end tag : div in Entity, line: 237 in /home/u552734802/domains/dailystocktopick.com/public_html/index.php on line 141
Warning: DOMDocument::loadHTML(): Unexpected end tag : li in Entity, line: 237 in /home/u552734802/domains/dailystocktopick.com/public_html/index.php on line 141
Warning: DOMDocument::loadHTML(): Unexpected end tag : div in Entity, line: 237 in /home/u552734802/domains/dailystocktopick.com/public_html/index.php on line 141
Warning: DOMDocument::loadHTML(): Unexpected end tag : a in Entity, line: 237 in /home/u552734802/domains/dailystocktopick.com/public_html/index.php on line 141
Warning: DOMDocument::loadHTML(): Unexpected end tag : a in Entity, line: 237 in /home/u552734802/domains/dailystocktopick.com/public_html/index.php on line 141
Warning: DOMDocument::loadHTML(): Unexpected end tag : a in Entity, line: 237 in /home/u552734802/domains/dailystocktopick.com/public_html/index.php on line 141
Warning: DOMDocument::loadHTML(): Unexpected end tag : a in Entity, line: 237 in /home/u552734802/domains/dailystocktopick.com/public_html/index.php on line 141
Warning: DOMDocument::loadHTML(): Unexpected end tag : a in Entity, line: 237 in /home/u552734802/domains/dailystocktopick.com/public_html/index.php on line 141
Warning: DOMDocument::loadHTML(): Unexpected end tag : a in Entity, line: 237 in /home/u552734802/domains/dailystocktopick.com/public_html/index.php on line 141
Warning: DOMDocument::loadHTML(): Unexpected end tag : a in Entity, line: 237 in /home/u552734802/domains/dailystocktopick.com/public_html/index.php on line 141
Warning: DOMDocument::loadHTML(): Unexpected end tag : a in Entity, line: 237 in /home/u552734802/domains/dailystocktopick.com/public_html/index.php on line 141
Warning: DOMDocument::loadHTML(): Unexpected end tag : a in Entity, line: 237 in /home/u552734802/domains/dailystocktopick.com/public_html/index.php on line 141
Warning: DOMDocument::loadHTML(): Unexpected end tag : a in Entity, line: 237 in /home/u552734802/domains/dailystocktopick.com/public_html/index.php on line 141
Warning: DOMDocument::loadHTML(): Unexpected end tag : a in Entity, line: 237 in /home/u552734802/domains/dailystocktopick.com/public_html/index.php on line 141
Warning: DOMDocument::loadHTML(): Unexpected end tag : a in Entity, line: 237 in /home/u552734802/domains/dailystocktopick.com/public_html/index.php on line 141
Warning: DOMDocument::loadHTML(): Unexpected end tag : a in Entity, line: 237 in /home/u552734802/domains/dailystocktopick.com/public_html/index.php on line 141
Warning: DOMDocument::loadHTML(): Unexpected end tag : div in Entity, line: 237 in /home/u552734802/domains/dailystocktopick.com/public_html/index.php on line 141
Warning: DOMDocument::loadHTML(): Unexpected end tag : li in Entity, line: 237 in /home/u552734802/domains/dailystocktopick.com/public_html/index.php on line 141
Warning: DOMDocument::loadHTML(): Unexpected end tag : div in Entity, line: 237 in /home/u552734802/domains/dailystocktopick.com/public_html/index.php on line 141
Warning: DOMDocument::loadHTML(): Unexpected end tag : a in Entity, line: 237 in /home/u552734802/domains/dailystocktopick.com/public_html/index.php on line 141
Warning: DOMDocument::loadHTML(): Unexpected end tag : a in Entity, line: 237 in /home/u552734802/domains/dailystocktopick.com/public_html/index.php on line 141
Warning: DOMDocument::loadHTML(): Unexpected end tag : a in Entity, line: 237 in /home/u552734802/domains/dailystocktopick.com/public_html/index.php on line 141
Warning: DOMDocument::loadHTML(): Unexpected end tag : a in Entity, line: 237 in /home/u552734802/domains/dailystocktopick.com/public_html/index.php on line 141
Warning: DOMDocument::loadHTML(): Unexpected end tag : a in Entity, line: 237 in /home/u552734802/domains/dailystocktopick.com/public_html/index.php on line 141
Warning: DOMDocument::loadHTML(): Unexpected end tag : a in Entity, line: 237 in /home/u552734802/domains/dailystocktopick.com/public_html/index.php on line 141
Warning: DOMDocument::loadHTML(): Unexpected end tag : a in Entity, line: 237 in /home/u552734802/domains/dailystocktopick.com/public_html/index.php on line 141
Warning: DOMDocument::loadHTML(): Unexpected end tag : a in Entity, line: 237 in /home/u552734802/domains/dailystocktopick.com/public_html/index.php on line 141
Warning: DOMDocument::loadHTML(): Unexpected end tag : a in Entity, line: 237 in /home/u552734802/domains/dailystocktopick.com/public_html/index.php on line 141
Warning: DOMDocument::loadHTML(): Unexpected end tag : a in Entity, line: 237 in /home/u552734802/domains/dailystocktopick.com/public_html/index.php on line 141
Warning: DOMDocument::loadHTML(): Unexpected end tag : a in Entity, line: 237 in /home/u552734802/domains/dailystocktopick.com/public_html/index.php on line 141
Warning: DOMDocument::loadHTML(): Unexpected end tag : a in Entity, line: 237 in /home/u552734802/domains/dailystocktopick.com/public_html/index.php on line 141
Warning: DOMDocument::loadHTML(): Unexpected end tag : a in Entity, line: 237 in /home/u552734802/domains/dailystocktopick.com/public_html/index.php on line 141
Warning: DOMDocument::loadHTML(): Unexpected end tag : a in Entity, line: 237 in /home/u552734802/domains/dailystocktopick.com/public_html/index.php on line 141
Warning: DOMDocument::loadHTML(): Unexpected end tag : a in Entity, line: 237 in /home/u552734802/domains/dailystocktopick.com/public_html/index.php on line 141
Warning: DOMDocument::loadHTML(): Unexpected end tag : a in Entity, line: 237 in /home/u552734802/domains/dailystocktopick.com/public_html/index.php on line 141
Warning: DOMDocument::loadHTML(): Unexpected end tag : div in Entity, line: 237 in /home/u552734802/domains/dailystocktopick.com/public_html/index.php on line 141
Warning: DOMDocument::loadHTML(): Unexpected end tag : li in Entity, line: 237 in /home/u552734802/domains/dailystocktopick.com/public_html/index.php on line 141
Warning: DOMDocument::loadHTML(): Unexpected end tag : div in Entity, line: 237 in /home/u552734802/domains/dailystocktopick.com/public_html/index.php on line 141
Warning: DOMDocument::loadHTML(): Unexpected end tag : a in Entity, line: 237 in /home/u552734802/domains/dailystocktopick.com/public_html/index.php on line 141
Warning: DOMDocument::loadHTML(): Unexpected end tag : a in Entity, line: 237 in /home/u552734802/domains/dailystocktopick.com/public_html/index.php on line 141
Warning: DOMDocument::loadHTML(): Unexpected end tag : a in Entity, line: 237 in /home/u552734802/domains/dailystocktopick.com/public_html/index.php on line 141
Warning: DOMDocument::loadHTML(): Unexpected end tag : a in Entity, line: 237 in /home/u552734802/domains/dailystocktopick.com/public_html/index.php on line 141
Warning: DOMDocument::loadHTML(): Unexpected end tag : a in Entity, line: 237 in /home/u552734802/domains/dailystocktopick.com/public_html/index.php on line 141
Warning: DOMDocument::loadHTML(): Unexpected end tag : a in Entity, line: 237 in /home/u552734802/domains/dailystocktopick.com/public_html/index.php on line 141
Warning: DOMDocument::loadHTML(): Unexpected end tag : a in Entity, line: 237 in /home/u552734802/domains/dailystocktopick.com/public_html/index.php on line 141
Warning: DOMDocument::loadHTML(): Unexpected end tag : a in Entity, line: 237 in /home/u552734802/domains/dailystocktopick.com/public_html/index.php on line 141
Warning: DOMDocument::loadHTML(): Unexpected end tag : a in Entity, line: 237 in /home/u552734802/domains/dailystocktopick.com/public_html/index.php on line 141
Warning: DOMDocument::loadHTML(): Unexpected end tag : a in Entity, line: 237 in /home/u552734802/domains/dailystocktopick.com/public_html/index.php on line 141
Warning: DOMDocument::loadHTML(): Unexpected end tag : a in Entity, line: 237 in /home/u552734802/domains/dailystocktopick.com/public_html/index.php on line 141
Warning: DOMDocument::loadHTML(): Unexpected end tag : a in Entity, line: 237 in /home/u552734802/domains/dailystocktopick.com/public_html/index.php on line 141
Warning: DOMDocument::loadHTML(): Unexpected end tag : a in Entity, line: 237 in /home/u552734802/domains/dailystocktopick.com/public_html/index.php on line 141
Warning: DOMDocument::loadHTML(): Unexpected end tag : a in Entity, line: 237 in /home/u552734802/domains/dailystocktopick.com/public_html/index.php on line 141
Warning: DOMDocument::loadHTML(): Unexpected end tag : a in Entity, line: 237 in /home/u552734802/domains/dailystocktopick.com/public_html/index.php on line 141
Warning: DOMDocument::loadHTML(): Unexpected end tag : a in Entity, line: 237 in /home/u552734802/domains/dailystocktopick.com/public_html/index.php on line 141
Warning: DOMDocument::loadHTML(): Unexpected end tag : div in Entity, line: 237 in /home/u552734802/domains/dailystocktopick.com/public_html/index.php on line 141
Warning: DOMDocument::loadHTML(): Unexpected end tag : li in Entity, line: 237 in /home/u552734802/domains/dailystocktopick.com/public_html/index.php on line 141
Warning: DOMDocument::loadHTML(): Unexpected end tag : div in Entity, line: 237 in /home/u552734802/domains/dailystocktopick.com/public_html/index.php on line 141
Warning: DOMDocument::loadHTML(): Unexpected end tag : a in Entity, line: 237 in /home/u552734802/domains/dailystocktopick.com/public_html/index.php on line 141
Warning: DOMDocument::loadHTML(): Unexpected end tag : a in Entity, line: 237 in /home/u552734802/domains/dailystocktopick.com/public_html/index.php on line 141
Warning: DOMDocument::loadHTML(): Unexpected end tag : a in Entity, line: 237 in /home/u552734802/domains/dailystocktopick.com/public_html/index.php on line 141
Warning: DOMDocument::loadHTML(): Unexpected end tag : a in Entity, line: 237 in /home/u552734802/domains/dailystocktopick.com/public_html/index.php on line 141
Warning: DOMDocument::loadHTML(): Unexpected end tag : a in Entity, line: 237 in /home/u552734802/domains/dailystocktopick.com/public_html/index.php on line 141
Warning: DOMDocument::loadHTML(): Unexpected end tag : a in Entity, line: 237 in /home/u552734802/domains/dailystocktopick.com/public_html/index.php on line 141
Warning: DOMDocument::loadHTML(): Unexpected end tag : a in Entity, line: 237 in /home/u552734802/domains/dailystocktopick.com/public_html/index.php on line 141
Warning: DOMDocument::loadHTML(): Unexpected end tag : a in Entity, line: 237 in /home/u552734802/domains/dailystocktopick.com/public_html/index.php on line 141
Warning: DOMDocument::loadHTML(): Unexpected end tag : a in Entity, line: 237 in /home/u552734802/domains/dailystocktopick.com/public_html/index.php on line 141
Warning: DOMDocument::loadHTML(): Unexpected end tag : a in Entity, line: 237 in /home/u552734802/domains/dailystocktopick.com/public_html/index.php on line 141
Warning: DOMDocument::loadHTML(): Unexpected end tag : a in Entity, line: 237 in /home/u552734802/domains/dailystocktopick.com/public_html/index.php on line 141
Warning: DOMDocument::loadHTML(): Unexpected end tag : a in Entity, line: 237 in /home/u552734802/domains/dailystocktopick.com/public_html/index.php on line 141
Warning: DOMDocument::loadHTML(): Unexpected end tag : a in Entity, line: 237 in /home/u552734802/domains/dailystocktopick.com/public_html/index.php on line 141
Warning: DOMDocument::loadHTML(): Unexpected end tag : a in Entity, line: 237 in /home/u552734802/domains/dailystocktopick.com/public_html/index.php on line 141
Warning: DOMDocument::loadHTML(): Unexpected end tag : a in Entity, line: 237 in /home/u552734802/domains/dailystocktopick.com/public_html/index.php on line 141
Warning: DOMDocument::loadHTML(): Unexpected end tag : a in Entity, line: 237 in /home/u552734802/domains/dailystocktopick.com/public_html/index.php on line 141
Warning: DOMDocument::loadHTML(): Unexpected end tag : a in Entity, line: 237 in /home/u552734802/domains/dailystocktopick.com/public_html/index.php on line 141
Warning: DOMDocument::loadHTML(): Unexpected end tag : a in Entity, line: 237 in /home/u552734802/domains/dailystocktopick.com/public_html/index.php on line 141
Warning: DOMDocument::loadHTML(): Unexpected end tag : div in Entity, line: 237 in /home/u552734802/domains/dailystocktopick.com/public_html/index.php on line 141
Warning: DOMDocument::loadHTML(): Unexpected end tag : li in Entity, line: 237 in /home/u552734802/domains/dailystocktopick.com/public_html/index.php on line 141
Warning: DOMDocument::loadHTML(): Unexpected end tag : div in Entity, line: 237 in /home/u552734802/domains/dailystocktopick.com/public_html/index.php on line 141
Warning: DOMDocument::loadHTML(): Unexpected end tag : a in Entity, line: 237 in /home/u552734802/domains/dailystocktopick.com/public_html/index.php on line 141
Warning: DOMDocument::loadHTML(): Unexpected end tag : a in Entity, line: 237 in /home/u552734802/domains/dailystocktopick.com/public_html/index.php on line 141
Warning: DOMDocument::loadHTML(): Unexpected end tag : a in Entity, line: 237 in /home/u552734802/domains/dailystocktopick.com/public_html/index.php on line 141
Warning: DOMDocument::loadHTML(): Unexpected end tag : a in Entity, line: 237 in /home/u552734802/domains/dailystocktopick.com/public_html/index.php on line 141
Warning: DOMDocument::loadHTML(): Unexpected end tag : a in Entity, line: 237 in /home/u552734802/domains/dailystocktopick.com/public_html/index.php on line 141
Warning: DOMDocument::loadHTML(): Unexpected end tag : a in Entity, line: 237 in /home/u552734802/domains/dailystocktopick.com/public_html/index.php on line 141
Warning: DOMDocument::loadHTML(): Unexpected end tag : a in Entity, line: 237 in /home/u552734802/domains/dailystocktopick.com/public_html/index.php on line 141
Warning: DOMDocument::loadHTML(): Unexpected end tag : a in Entity, line: 237 in /home/u552734802/domains/dailystocktopick.com/public_html/index.php on line 141
Warning: DOMDocument::loadHTML(): Unexpected end tag : a in Entity, line: 237 in /home/u552734802/domains/dailystocktopick.com/public_html/index.php on line 141
Warning: DOMDocument::loadHTML(): Unexpected end tag : a in Entity, line: 237 in /home/u552734802/domains/dailystocktopick.com/public_html/index.php on line 141
Warning: DOMDocument::loadHTML(): Unexpected end tag : div in Entity, line: 237 in /home/u552734802/domains/dailystocktopick.com/public_html/index.php on line 141
Warning: DOMDocument::loadHTML(): Unexpected end tag : li in Entity, line: 237 in /home/u552734802/domains/dailystocktopick.com/public_html/index.php on line 141
Warning: DOMDocument::loadHTML(): Unexpected end tag : div in Entity, line: 237 in /home/u552734802/domains/dailystocktopick.com/public_html/index.php on line 141
Warning: DOMDocument::loadHTML(): Unexpected end tag : a in Entity, line: 237 in /home/u552734802/domains/dailystocktopick.com/public_html/index.php on line 141
Warning: DOMDocument::loadHTML(): Unexpected end tag : a in Entity, line: 237 in /home/u552734802/domains/dailystocktopick.com/public_html/index.php on line 141
Warning: DOMDocument::loadHTML(): Unexpected end tag : a in Entity, line: 237 in /home/u552734802/domains/dailystocktopick.com/public_html/index.php on line 141
Warning: DOMDocument::loadHTML(): Unexpected end tag : a in Entity, line: 237 in /home/u552734802/domains/dailystocktopick.com/public_html/index.php on line 141
Warning: DOMDocument::loadHTML(): Unexpected end tag : a in Entity, line: 237 in /home/u552734802/domains/dailystocktopick.com/public_html/index.php on line 141
Warning: DOMDocument::loadHTML(): Unexpected end tag : a in Entity, line: 237 in /home/u552734802/domains/dailystocktopick.com/public_html/index.php on line 141
Warning: DOMDocument::loadHTML(): Unexpected end tag : a in Entity, line: 237 in /home/u552734802/domains/dailystocktopick.com/public_html/index.php on line 141
Warning: DOMDocument::loadHTML(): Unexpected end tag : a in Entity, line: 237 in /home/u552734802/domains/dailystocktopick.com/public_html/index.php on line 141
Warning: DOMDocument::loadHTML(): Unexpected end tag : a in Entity, line: 237 in /home/u552734802/domains/dailystocktopick.com/public_html/index.php on line 141
Warning: DOMDocument::loadHTML(): Unexpected end tag : a in Entity, line: 237 in /home/u552734802/domains/dailystocktopick.com/public_html/index.php on line 141
Warning: DOMDocument::loadHTML(): Unexpected end tag : div in Entity, line: 237 in /home/u552734802/domains/dailystocktopick.com/public_html/index.php on line 141
Warning: DOMDocument::loadHTML(): Unexpected end tag : li in Entity, line: 237 in /home/u552734802/domains/dailystocktopick.com/public_html/index.php on line 141
Warning: DOMDocument::loadHTML(): Unexpected end tag : div in Entity, line: 237 in /home/u552734802/domains/dailystocktopick.com/public_html/index.php on line 141
Warning: DOMDocument::loadHTML(): Unexpected end tag : a in Entity, line: 237 in /home/u552734802/domains/dailystocktopick.com/public_html/index.php on line 141
Warning: DOMDocument::loadHTML(): Unexpected end tag : a in Entity, line: 237 in /home/u552734802/domains/dailystocktopick.com/public_html/index.php on line 141
Warning: DOMDocument::loadHTML(): Unexpected end tag : a in Entity, line: 237 in /home/u552734802/domains/dailystocktopick.com/public_html/index.php on line 141
Warning: DOMDocument::loadHTML(): Unexpected end tag : a in Entity, line: 237 in /home/u552734802/domains/dailystocktopick.com/public_html/index.php on line 141
Warning: DOMDocument::loadHTML(): Unexpected end tag : a in Entity, line: 237 in /home/u552734802/domains/dailystocktopick.com/public_html/index.php on line 141
Warning: DOMDocument::loadHTML(): Unexpected end tag : a in Entity, line: 237 in /home/u552734802/domains/dailystocktopick.com/public_html/index.php on line 141
Warning: DOMDocument::loadHTML(): Unexpected end tag : a in Entity, line: 237 in /home/u552734802/domains/dailystocktopick.com/public_html/index.php on line 141
Warning: DOMDocument::loadHTML(): Unexpected end tag : a in Entity, line: 237 in /home/u552734802/domains/dailystocktopick.com/public_html/index.php on line 141
Warning: DOMDocument::loadHTML(): Unexpected end tag : a in Entity, line: 237 in /home/u552734802/domains/dailystocktopick.com/public_html/index.php on line 141
Warning: DOMDocument::loadHTML(): Unexpected end tag : a in Entity, line: 237 in /home/u552734802/domains/dailystocktopick.com/public_html/index.php on line 141
Warning: DOMDocument::loadHTML(): Unexpected end tag : a in Entity, line: 237 in /home/u552734802/domains/dailystocktopick.com/public_html/index.php on line 141
Warning: DOMDocument::loadHTML(): Unexpected end tag : div in Entity, line: 237 in /home/u552734802/domains/dailystocktopick.com/public_html/index.php on line 141
Warning: DOMDocument::loadHTML(): Unexpected end tag : li in Entity, line: 237 in /home/u552734802/domains/dailystocktopick.com/public_html/index.php on line 141
Warning: DOMDocument::loadHTML(): Unexpected end tag : div in Entity, line: 237 in /home/u552734802/domains/dailystocktopick.com/public_html/index.php on line 141
Warning: DOMDocument::loadHTML(): Unexpected end tag : a in Entity, line: 237 in /home/u552734802/domains/dailystocktopick.com/public_html/index.php on line 141
Warning: DOMDocument::loadHTML(): Unexpected end tag : a in Entity, line: 237 in /home/u552734802/domains/dailystocktopick.com/public_html/index.php on line 141
Warning: DOMDocument::loadHTML(): Unexpected end tag : a in Entity, line: 237 in /home/u552734802/domains/dailystocktopick.com/public_html/index.php on line 141
Warning: DOMDocument::loadHTML(): Unexpected end tag : a in Entity, line: 237 in /home/u552734802/domains/dailystocktopick.com/public_html/index.php on line 141
Warning: DOMDocument::loadHTML(): Unexpected end tag : a in Entity, line: 237 in /home/u552734802/domains/dailystocktopick.com/public_html/index.php on line 141
Warning: DOMDocument::loadHTML(): Unexpected end tag : a in Entity, line: 237 in /home/u552734802/domains/dailystocktopick.com/public_html/index.php on line 141
Warning: DOMDocument::loadHTML(): Unexpected end tag : a in Entity, line: 237 in /home/u552734802/domains/dailystocktopick.com/public_html/index.php on line 141
Warning: DOMDocument::loadHTML(): Unexpected end tag : a in Entity, line: 237 in /home/u552734802/domains/dailystocktopick.com/public_html/index.php on line 141
Warning: DOMDocument::loadHTML(): Unexpected end tag : a in Entity, line: 237 in /home/u552734802/domains/dailystocktopick.com/public_html/index.php on line 141
Warning: DOMDocument::loadHTML(): Unexpected end tag : a in Entity, line: 237 in /home/u552734802/domains/dailystocktopick.com/public_html/index.php on line 141
Warning: DOMDocument::loadHTML(): Unexpected end tag : a in Entity, line: 237 in /home/u552734802/domains/dailystocktopick.com/public_html/index.php on line 141
Warning: DOMDocument::loadHTML(): Unexpected end tag : a in Entity, line: 237 in /home/u552734802/domains/dailystocktopick.com/public_html/index.php on line 141
Warning: DOMDocument::loadHTML(): Unexpected end tag : a in Entity, line: 237 in /home/u552734802/domains/dailystocktopick.com/public_html/index.php on line 141
Warning: DOMDocument::loadHTML(): Unexpected end tag : a in Entity, line: 237 in /home/u552734802/domains/dailystocktopick.com/public_html/index.php on line 141
Warning: DOMDocument::loadHTML(): Unexpected end tag : a in Entity, line: 237 in /home/u552734802/domains/dailystocktopick.com/public_html/index.php on line 141
Warning: DOMDocument::loadHTML(): Unexpected end tag : a in Entity, line: 237 in /home/u552734802/domains/dailystocktopick.com/public_html/index.php on line 141
Warning: DOMDocument::loadHTML(): Unexpected end tag : a in Entity, line: 237 in /home/u552734802/domains/dailystocktopick.com/public_html/index.php on line 141
Warning: DOMDocument::loadHTML(): Unexpected end tag : div in Entity, line: 237 in /home/u552734802/domains/dailystocktopick.com/public_html/index.php on line 141
Warning: DOMDocument::loadHTML(): Unexpected end tag : li in Entity, line: 237 in /home/u552734802/domains/dailystocktopick.com/public_html/index.php on line 141
Warning: DOMDocument::loadHTML(): Unexpected end tag : div in Entity, line: 237 in /home/u552734802/domains/dailystocktopick.com/public_html/index.php on line 141
Warning: DOMDocument::loadHTML(): Unexpected end tag : a in Entity, line: 237 in /home/u552734802/domains/dailystocktopick.com/public_html/index.php on line 141
Warning: DOMDocument::loadHTML(): Unexpected end tag : a in Entity, line: 237 in /home/u552734802/domains/dailystocktopick.com/public_html/index.php on line 141
Warning: DOMDocument::loadHTML(): Unexpected end tag : a in Entity, line: 237 in /home/u552734802/domains/dailystocktopick.com/public_html/index.php on line 141
Warning: DOMDocument::loadHTML(): Unexpected end tag : a in Entity, line: 237 in /home/u552734802/domains/dailystocktopick.com/public_html/index.php on line 141
Warning: DOMDocument::loadHTML(): Unexpected end tag : a in Entity, line: 237 in /home/u552734802/domains/dailystocktopick.com/public_html/index.php on line 141
Warning: DOMDocument::loadHTML(): Unexpected end tag : a in Entity, line: 237 in /home/u552734802/domains/dailystocktopick.com/public_html/index.php on line 141
Warning: DOMDocument::loadHTML(): Unexpected end tag : a in Entity, line: 237 in /home/u552734802/domains/dailystocktopick.com/public_html/index.php on line 141
Warning: DOMDocument::loadHTML(): Unexpected end tag : a in Entity, line: 237 in /home/u552734802/domains/dailystocktopick.com/public_html/index.php on line 141
Warning: DOMDocument::loadHTML(): Unexpected end tag : a in Entity, line: 237 in /home/u552734802/domains/dailystocktopick.com/public_html/index.php on line 141
Warning: DOMDocument::loadHTML(): Unexpected end tag : a in Entity, line: 237 in /home/u552734802/domains/dailystocktopick.com/public_html/index.php on line 141
Warning: DOMDocument::loadHTML(): Unexpected end tag : a in Entity, line: 237 in /home/u552734802/domains/dailystocktopick.com/public_html/index.php on line 141
Warning: DOMDocument::loadHTML(): Unexpected end tag : a in Entity, line: 237 in /home/u552734802/domains/dailystocktopick.com/public_html/index.php on line 141
Warning: DOMDocument::loadHTML(): Unexpected end tag : a in Entity, line: 237 in /home/u552734802/domains/dailystocktopick.com/public_html/index.php on line 141
Warning: DOMDocument::loadHTML(): Unexpected end tag : div in Entity, line: 237 in /home/u552734802/domains/dailystocktopick.com/public_html/index.php on line 141
Warning: DOMDocument::loadHTML(): Unexpected end tag : li in Entity, line: 237 in /home/u552734802/domains/dailystocktopick.com/public_html/index.php on line 141
Warning: DOMDocument::loadHTML(): Unexpected end tag : div in Entity, line: 237 in /home/u552734802/domains/dailystocktopick.com/public_html/index.php on line 141
Warning: DOMDocument::loadHTML(): Unexpected end tag : a in Entity, line: 237 in /home/u552734802/domains/dailystocktopick.com/public_html/index.php on line 141
Warning: DOMDocument::loadHTML(): Unexpected end tag : a in Entity, line: 237 in /home/u552734802/domains/dailystocktopick.com/public_html/index.php on line 141
Warning: DOMDocument::loadHTML(): Unexpected end tag : a in Entity, line: 237 in /home/u552734802/domains/dailystocktopick.com/public_html/index.php on line 141
Warning: DOMDocument::loadHTML(): Unexpected end tag : a in Entity, line: 237 in /home/u552734802/domains/dailystocktopick.com/public_html/index.php on line 141
Warning: DOMDocument::loadHTML(): Unexpected end tag : a in Entity, line: 237 in /home/u552734802/domains/dailystocktopick.com/public_html/index.php on line 141
Warning: DOMDocument::loadHTML(): Unexpected end tag : a in Entity, line: 237 in /home/u552734802/domains/dailystocktopick.com/public_html/index.php on line 141
Warning: DOMDocument::loadHTML(): Unexpected end tag : a in Entity, line: 237 in /home/u552734802/domains/dailystocktopick.com/public_html/index.php on line 141
Warning: DOMDocument::loadHTML(): Unexpected end tag : a in Entity, line: 237 in /home/u552734802/domains/dailystocktopick.com/public_html/index.php on line 141
Warning: DOMDocument::loadHTML(): Unexpected end tag : a in Entity, line: 237 in /home/u552734802/domains/dailystocktopick.com/public_html/index.php on line 141
Warning: DOMDocument::loadHTML(): Unexpected end tag : a in Entity, line: 237 in /home/u552734802/domains/dailystocktopick.com/public_html/index.php on line 141
Warning: DOMDocument::loadHTML(): Unexpected end tag : a in Entity, line: 237 in /home/u552734802/domains/dailystocktopick.com/public_html/index.php on line 141
Warning: DOMDocument::loadHTML(): Unexpected end tag : a in Entity, line: 237 in /home/u552734802/domains/dailystocktopick.com/public_html/index.php on line 141
Warning: DOMDocument::loadHTML(): Unexpected end tag : a in Entity, line: 237 in /home/u552734802/domains/dailystocktopick.com/public_html/index.php on line 141
Warning: DOMDocument::loadHTML(): Unexpected end tag : a in Entity, line: 237 in /home/u552734802/domains/dailystocktopick.com/public_html/index.php on line 141
Warning: DOMDocument::loadHTML(): Unexpected end tag : a in Entity, line: 237 in /home/u552734802/domains/dailystocktopick.com/public_html/index.php on line 141
Warning: DOMDocument::loadHTML(): Unexpected end tag : div in Entity, line: 237 in /home/u552734802/domains/dailystocktopick.com/public_html/index.php on line 141
Warning: DOMDocument::loadHTML(): Unexpected end tag : li in Entity, line: 237 in /home/u552734802/domains/dailystocktopick.com/public_html/index.php on line 141
Warning: DOMDocument::loadHTML(): Unexpected end tag : div in Entity, line: 237 in /home/u552734802/domains/dailystocktopick.com/public_html/index.php on line 141
Warning: DOMDocument::loadHTML(): Unexpected end tag : a in Entity, line: 237 in /home/u552734802/domains/dailystocktopick.com/public_html/index.php on line 141
Warning: DOMDocument::loadHTML(): Unexpected end tag : a in Entity, line: 237 in /home/u552734802/domains/dailystocktopick.com/public_html/index.php on line 141
Warning: DOMDocument::loadHTML(): Unexpected end tag : a in Entity, line: 237 in /home/u552734802/domains/dailystocktopick.com/public_html/index.php on line 141
Warning: DOMDocument::loadHTML(): Unexpected end tag : a in Entity, line: 237 in /home/u552734802/domains/dailystocktopick.com/public_html/index.php on line 141
Warning: DOMDocument::loadHTML(): Unexpected end tag : a in Entity, line: 237 in /home/u552734802/domains/dailystocktopick.com/public_html/index.php on line 141
Warning: DOMDocument::loadHTML(): Unexpected end tag : a in Entity, line: 237 in /home/u552734802/domains/dailystocktopick.com/public_html/index.php on line 141
Warning: DOMDocument::loadHTML(): Unexpected end tag : a in Entity, line: 237 in /home/u552734802/domains/dailystocktopick.com/public_html/index.php on line 141
Warning: DOMDocument::loadHTML(): Unexpected end tag : a in Entity, line: 237 in /home/u552734802/domains/dailystocktopick.com/public_html/index.php on line 141
Warning: DOMDocument::loadHTML(): Unexpected end tag : a in Entity, line: 237 in /home/u552734802/domains/dailystocktopick.com/public_html/index.php on line 141
Warning: DOMDocument::loadHTML(): Unexpected end tag : a in Entity, line: 237 in /home/u552734802/domains/dailystocktopick.com/public_html/index.php on line 141
Warning: DOMDocument::loadHTML(): Unexpected end tag : div in Entity, line: 237 in /home/u552734802/domains/dailystocktopick.com/public_html/index.php on line 141
Warning: DOMDocument::loadHTML(): Unexpected end tag : li in Entity, line: 237 in /home/u552734802/domains/dailystocktopick.com/public_html/index.php on line 141
Warning: DOMDocument::loadHTML(): Unexpected end tag : div in Entity, line: 237 in /home/u552734802/domains/dailystocktopick.com/public_html/index.php on line 141
Warning: DOMDocument::loadHTML(): Unexpected end tag : a in Entity, line: 237 in /home/u552734802/domains/dailystocktopick.com/public_html/index.php on line 141
Warning: DOMDocument::loadHTML(): Unexpected end tag : a in Entity, line: 237 in /home/u552734802/domains/dailystocktopick.com/public_html/index.php on line 141
Warning: DOMDocument::loadHTML(): Unexpected end tag : a in Entity, line: 237 in /home/u552734802/domains/dailystocktopick.com/public_html/index.php on line 141
Warning: DOMDocument::loadHTML(): Unexpected end tag : a in Entity, line: 237 in /home/u552734802/domains/dailystocktopick.com/public_html/index.php on line 141
Warning: DOMDocument::loadHTML(): Unexpected end tag : a in Entity, line: 237 in /home/u552734802/domains/dailystocktopick.com/public_html/index.php on line 141
Warning: DOMDocument::loadHTML(): Unexpected end tag : a in Entity, line: 237 in /home/u552734802/domains/dailystocktopick.com/public_html/index.php on line 141
Warning: DOMDocument::loadHTML(): Unexpected end tag : a in Entity, line: 237 in /home/u552734802/domains/dailystocktopick.com/public_html/index.php on line 141
Warning: DOMDocument::loadHTML(): Unexpected end tag : a in Entity, line: 237 in /home/u552734802/domains/dailystocktopick.com/public_html/index.php on line 141
Warning: DOMDocument::loadHTML(): Unexpected end tag : a in Entity, line: 237 in /home/u552734802/domains/dailystocktopick.com/public_html/index.php on line 141
Warning: DOMDocument::loadHTML(): Unexpected end tag : a in Entity, line: 237 in /home/u552734802/domains/dailystocktopick.com/public_html/index.php on line 141
Warning: DOMDocument::loadHTML(): Unexpected end tag : a in Entity, line: 237 in /home/u552734802/domains/dailystocktopick.com/public_html/index.php on line 141
Warning: DOMDocument::loadHTML(): Unexpected end tag : a in Entity, line: 237 in /home/u552734802/domains/dailystocktopick.com/public_html/index.php on line 141
Warning: DOMDocument::loadHTML(): Unexpected end tag : a in Entity, line: 237 in /home/u552734802/domains/dailystocktopick.com/public_html/index.php on line 141
Warning: DOMDocument::loadHTML(): Unexpected end tag : a in Entity, line: 237 in /home/u552734802/domains/dailystocktopick.com/public_html/index.php on line 141
Warning: DOMDocument::loadHTML(): Unexpected end tag : a in Entity, line: 237 in /home/u552734802/domains/dailystocktopick.com/public_html/index.php on line 141
Warning: DOMDocument::loadHTML(): Unexpected end tag : a in Entity, line: 237 in /home/u552734802/domains/dailystocktopick.com/public_html/index.php on line 141
Warning: DOMDocument::loadHTML(): Unexpected end tag : a in Entity, line: 237 in /home/u552734802/domains/dailystocktopick.com/public_html/index.php on line 141
Warning: DOMDocument::loadHTML(): Unexpected end tag : a in Entity, line: 237 in /home/u552734802/domains/dailystocktopick.com/public_html/index.php on line 141
Warning: DOMDocument::loadHTML(): Unexpected end tag : a in Entity, line: 237 in /home/u552734802/domains/dailystocktopick.com/public_html/index.php on line 141
Warning: DOMDocument::loadHTML(): Unexpected end tag : div in Entity, line: 237 in /home/u552734802/domains/dailystocktopick.com/public_html/index.php on line 141
Warning: DOMDocument::loadHTML(): Unexpected end tag : li in Entity, line: 237 in /home/u552734802/domains/dailystocktopick.com/public_html/index.php on line 141
Warning: DOMDocument::loadHTML(): Unexpected end tag : div in Entity, line: 237 in /home/u552734802/domains/dailystocktopick.com/public_html/index.php on line 141
Warning: DOMDocument::loadHTML(): Unexpected end tag : a in Entity, line: 237 in /home/u552734802/domains/dailystocktopick.com/public_html/index.php on line 141
Warning: DOMDocument::loadHTML(): Unexpected end tag : a in Entity, line: 237 in /home/u552734802/domains/dailystocktopick.com/public_html/index.php on line 141
Warning: DOMDocument::loadHTML(): Unexpected end tag : a in Entity, line: 237 in /home/u552734802/domains/dailystocktopick.com/public_html/index.php on line 141
Warning: DOMDocument::loadHTML(): Unexpected end tag : a in Entity, line: 237 in /home/u552734802/domains/dailystocktopick.com/public_html/index.php on line 141
Warning: DOMDocument::loadHTML(): Unexpected end tag : a in Entity, line: 237 in /home/u552734802/domains/dailystocktopick.com/public_html/index.php on line 141
Warning: DOMDocument::loadHTML(): Unexpected end tag : a in Entity, line: 237 in /home/u552734802/domains/dailystocktopick.com/public_html/index.php on line 141
Warning: DOMDocument::loadHTML(): Unexpected end tag : a in Entity, line: 237 in /home/u552734802/domains/dailystocktopick.com/public_html/index.php on line 141
Warning: DOMDocument::loadHTML(): Unexpected end tag : a in Entity, line: 237 in /home/u552734802/domains/dailystocktopick.com/public_html/index.php on line 141
Warning: DOMDocument::loadHTML(): Unexpected end tag : a in Entity, line: 237 in /home/u552734802/domains/dailystocktopick.com/public_html/index.php on line 141
Warning: DOMDocument::loadHTML(): Unexpected end tag : a in Entity, line: 237 in /home/u552734802/domains/dailystocktopick.com/public_html/index.php on line 141
Warning: DOMDocument::loadHTML(): Unexpected end tag : a in Entity, line: 237 in /home/u552734802/domains/dailystocktopick.com/public_html/index.php on line 141
Warning: DOMDocument::loadHTML(): Unexpected end tag : a in Entity, line: 237 in /home/u552734802/domains/dailystocktopick.com/public_html/index.php on line 141
Warning: DOMDocument::loadHTML(): Unexpected end tag : a in Entity, line: 237 in /home/u552734802/domains/dailystocktopick.com/public_html/index.php on line 141
Warning: DOMDocument::loadHTML(): Unexpected end tag : div in Entity, line: 237 in /home/u552734802/domains/dailystocktopick.com/public_html/index.php on line 141
Warning: DOMDocument::loadHTML(): Unexpected end tag : li in Entity, line: 237 in /home/u552734802/domains/dailystocktopick.com/public_html/index.php on line 141
Warning: DOMDocument::loadHTML(): Unexpected end tag : div in Entity, line: 237 in /home/u552734802/domains/dailystocktopick.com/public_html/index.php on line 141
Warning: DOMDocument::loadHTML(): Unexpected end tag : a in Entity, line: 237 in /home/u552734802/domains/dailystocktopick.com/public_html/index.php on line 141
Warning: DOMDocument::loadHTML(): Unexpected end tag : a in Entity, line: 237 in /home/u552734802/domains/dailystocktopick.com/public_html/index.php on line 141
Warning: DOMDocument::loadHTML(): Unexpected end tag : a in Entity, line: 237 in /home/u552734802/domains/dailystocktopick.com/public_html/index.php on line 141
Warning: DOMDocument::loadHTML(): Unexpected end tag : a in Entity, line: 237 in /home/u552734802/domains/dailystocktopick.com/public_html/index.php on line 141
Warning: DOMDocument::loadHTML(): Unexpected end tag : a in Entity, line: 237 in /home/u552734802/domains/dailystocktopick.com/public_html/index.php on line 141
Warning: DOMDocument::loadHTML(): Unexpected end tag : a in Entity, line: 237 in /home/u552734802/domains/dailystocktopick.com/public_html/index.php on line 141
Warning: DOMDocument::loadHTML(): Unexpected end tag : a in Entity, line: 237 in /home/u552734802/domains/dailystocktopick.com/public_html/index.php on line 141
Warning: DOMDocument::loadHTML(): Unexpected end tag : a in Entity, line: 237 in /home/u552734802/domains/dailystocktopick.com/public_html/index.php on line 141
Warning: DOMDocument::loadHTML(): Unexpected end tag : div in Entity, line: 237 in /home/u552734802/domains/dailystocktopick.com/public_html/index.php on line 141
Warning: DOMDocument::loadHTML(): Unexpected end tag : li in Entity, line: 237 in /home/u552734802/domains/dailystocktopick.com/public_html/index.php on line 141
Warning: DOMDocument::loadHTML(): Unexpected end tag : div in Entity, line: 237 in /home/u552734802/domains/dailystocktopick.com/public_html/index.php on line 141
Warning: DOMDocument::loadHTML(): Unexpected end tag : a in Entity, line: 237 in /home/u552734802/domains/dailystocktopick.com/public_html/index.php on line 141
Warning: DOMDocument::loadHTML(): Unexpected end tag : a in Entity, line: 237 in /home/u552734802/domains/dailystocktopick.com/public_html/index.php on line 141
Warning: DOMDocument::loadHTML(): Unexpected end tag : a in Entity, line: 237 in /home/u552734802/domains/dailystocktopick.com/public_html/index.php on line 141
Warning: DOMDocument::loadHTML(): Unexpected end tag : a in Entity, line: 237 in /home/u552734802/domains/dailystocktopick.com/public_html/index.php on line 141
Warning: DOMDocument::loadHTML(): Unexpected end tag : a in Entity, line: 237 in /home/u552734802/domains/dailystocktopick.com/public_html/index.php on line 141
Warning: DOMDocument::loadHTML(): Unexpected end tag : a in Entity, line: 237 in /home/u552734802/domains/dailystocktopick.com/public_html/index.php on line 141
Warning: DOMDocument::loadHTML(): Unexpected end tag : a in Entity, line: 237 in /home/u552734802/domains/dailystocktopick.com/public_html/index.php on line 141
Warning: DOMDocument::loadHTML(): Unexpected end tag : a in Entity, line: 237 in /home/u552734802/domains/dailystocktopick.com/public_html/index.php on line 141
Warning: DOMDocument::loadHTML(): Unexpected end tag : a in Entity, line: 237 in /home/u552734802/domains/dailystocktopick.com/public_html/index.php on line 141
Warning: DOMDocument::loadHTML(): Unexpected end tag : a in Entity, line: 237 in /home/u552734802/domains/dailystocktopick.com/public_html/index.php on line 141
Warning: DOMDocument::loadHTML(): Unexpected end tag : a in Entity, line: 237 in /home/u552734802/domains/dailystocktopick.com/public_html/index.php on line 141
Warning: DOMDocument::loadHTML(): Unexpected end tag : a in Entity, line: 237 in /home/u552734802/domains/dailystocktopick.com/public_html/index.php on line 141
Warning: DOMDocument::loadHTML(): Unexpected end tag : a in Entity, line: 237 in /home/u552734802/domains/dailystocktopick.com/public_html/index.php on line 141
Warning: DOMDocument::loadHTML(): Unexpected end tag : a in Entity, line: 237 in /home/u552734802/domains/dailystocktopick.com/public_html/index.php on line 141
Warning: DOMDocument::loadHTML(): Unexpected end tag : a in Entity, line: 237 in /home/u552734802/domains/dailystocktopick.com/public_html/index.php on line 141
Warning: DOMDocument::loadHTML(): Unexpected end tag : a in Entity, line: 237 in /home/u552734802/domains/dailystocktopick.com/public_html/index.php on line 141
Warning: DOMDocument::loadHTML(): Unexpected end tag : div in Entity, line: 237 in /home/u552734802/domains/dailystocktopick.com/public_html/index.php on line 141
Warning: DOMDocument::loadHTML(): Unexpected end tag : li in Entity, line: 237 in /home/u552734802/domains/dailystocktopick.com/public_html/index.php on line 141
Warning: DOMDocument::loadHTML(): Unexpected end tag : div in Entity, line: 237 in /home/u552734802/domains/dailystocktopick.com/public_html/index.php on line 141
Warning: DOMDocument::loadHTML(): Unexpected end tag : a in Entity, line: 237 in /home/u552734802/domains/dailystocktopick.com/public_html/index.php on line 141
Warning: DOMDocument::loadHTML(): Unexpected end tag : a in Entity, line: 237 in /home/u552734802/domains/dailystocktopick.com/public_html/index.php on line 141
Warning: DOMDocument::loadHTML(): Unexpected end tag : a in Entity, line: 237 in /home/u552734802/domains/dailystocktopick.com/public_html/index.php on line 141
Warning: DOMDocument::loadHTML(): Unexpected end tag : a in Entity, line: 237 in /home/u552734802/domains/dailystocktopick.com/public_html/index.php on line 141
Warning: DOMDocument::loadHTML(): Unexpected end tag : a in Entity, line: 237 in /home/u552734802/domains/dailystocktopick.com/public_html/index.php on line 141
Warning: DOMDocument::loadHTML(): Unexpected end tag : a in Entity, line: 237 in /home/u552734802/domains/dailystocktopick.com/public_html/index.php on line 141
Warning: DOMDocument::loadHTML(): Unexpected end tag : a in Entity, line: 237 in /home/u552734802/domains/dailystocktopick.com/public_html/index.php on line 141
Warning: DOMDocument::loadHTML(): Unexpected end tag : a in Entity, line: 237 in /home/u552734802/domains/dailystocktopick.com/public_html/index.php on line 141
Warning: DOMDocument::loadHTML(): Unexpected end tag : a in Entity, line: 237 in /home/u552734802/domains/dailystocktopick.com/public_html/index.php on line 141
Warning: DOMDocument::loadHTML(): Unexpected end tag : a in Entity, line: 237 in /home/u552734802/domains/dailystocktopick.com/public_html/index.php on line 141
Warning: DOMDocument::loadHTML(): Unexpected end tag : a in Entity, line: 237 in /home/u552734802/domains/dailystocktopick.com/public_html/index.php on line 141
Warning: DOMDocument::loadHTML(): Unexpected end tag : a in Entity, line: 237 in /home/u552734802/domains/dailystocktopick.com/public_html/index.php on line 141
Warning: DOMDocument::loadHTML(): Unexpected end tag : a in Entity, line: 237 in /home/u552734802/domains/dailystocktopick.com/public_html/index.php on line 141
Warning: DOMDocument::loadHTML(): Unexpected end tag : a in Entity, line: 237 in /home/u552734802/domains/dailystocktopick.com/public_html/index.php on line 141
Warning: DOMDocument::loadHTML(): Unexpected end tag : a in Entity, line: 237 in /home/u552734802/domains/dailystocktopick.com/public_html/index.php on line 141
Warning: DOMDocument::loadHTML(): Unexpected end tag : div in Entity, line: 237 in /home/u552734802/domains/dailystocktopick.com/public_html/index.php on line 141
Warning: DOMDocument::loadHTML(): Unexpected end tag : li in Entity, line: 237 in /home/u552734802/domains/dailystocktopick.com/public_html/index.php on line 141
Warning: DOMDocument::loadHTML(): Unexpected end tag : div in Entity, line: 237 in /home/u552734802/domains/dailystocktopick.com/public_html/index.php on line 141
Warning: DOMDocument::loadHTML(): Unexpected end tag : a in Entity, line: 237 in /home/u552734802/domains/dailystocktopick.com/public_html/index.php on line 141
Warning: DOMDocument::loadHTML(): Unexpected end tag : a in Entity, line: 237 in /home/u552734802/domains/dailystocktopick.com/public_html/index.php on line 141
Warning: DOMDocument::loadHTML(): Unexpected end tag : a in Entity, line: 237 in /home/u552734802/domains/dailystocktopick.com/public_html/index.php on line 141
Warning: DOMDocument::loadHTML(): Unexpected end tag : a in Entity, line: 237 in /home/u552734802/domains/dailystocktopick.com/public_html/index.php on line 141
Warning: DOMDocument::loadHTML(): Unexpected end tag : a in Entity, line: 237 in /home/u552734802/domains/dailystocktopick.com/public_html/index.php on line 141
Warning: DOMDocument::loadHTML(): Unexpected end tag : a in Entity, line: 237 in /home/u552734802/domains/dailystocktopick.com/public_html/index.php on line 141
Warning: DOMDocument::loadHTML(): Unexpected end tag : a in Entity, line: 237 in /home/u552734802/domains/dailystocktopick.com/public_html/index.php on line 141
Warning: DOMDocument::loadHTML(): Unexpected end tag : a in Entity, line: 237 in /home/u552734802/domains/dailystocktopick.com/public_html/index.php on line 141
Warning: DOMDocument::loadHTML(): Unexpected end tag : a in Entity, line: 237 in /home/u552734802/domains/dailystocktopick.com/public_html/index.php on line 141
Warning: DOMDocument::loadHTML(): Unexpected end tag : a in Entity, line: 237 in /home/u552734802/domains/dailystocktopick.com/public_html/index.php on line 141
Warning: DOMDocument::loadHTML(): Unexpected end tag : a in Entity, line: 237 in /home/u552734802/domains/dailystocktopick.com/public_html/index.php on line 141
Warning: DOMDocument::loadHTML(): Unexpected end tag : a in Entity, line: 237 in /home/u552734802/domains/dailystocktopick.com/public_html/index.php on line 141
Warning: DOMDocument::loadHTML(): Unexpected end tag : a in Entity, line: 237 in /home/u552734802/domains/dailystocktopick.com/public_html/index.php on line 141
Warning: DOMDocument::loadHTML(): Unexpected end tag : a in Entity, line: 237 in /home/u552734802/domains/dailystocktopick.com/public_html/index.php on line 141
Warning: DOMDocument::loadHTML(): Unexpected end tag : a in Entity, line: 237 in /home/u552734802/domains/dailystocktopick.com/public_html/index.php on line 141
Warning: DOMDocument::loadHTML(): Unexpected end tag : a in Entity, line: 237 in /home/u552734802/domains/dailystocktopick.com/public_html/index.php on line 141
Warning: DOMDocument::loadHTML(): Unexpected end tag : a in Entity, line: 237 in /home/u552734802/domains/dailystocktopick.com/public_html/index.php on line 141
Warning: DOMDocument::loadHTML(): Unexpected end tag : div in Entity, line: 237 in /home/u552734802/domains/dailystocktopick.com/public_html/index.php on line 141
Warning: DOMDocument::loadHTML(): Unexpected end tag : li in Entity, line: 237 in /home/u552734802/domains/dailystocktopick.com/public_html/index.php on line 141
Warning: DOMDocument::loadHTML(): Unexpected end tag : div in Entity, line: 237 in /home/u552734802/domains/dailystocktopick.com/public_html/index.php on line 141
Warning: DOMDocument::loadHTML(): Unexpected end tag : a in Entity, line: 237 in /home/u552734802/domains/dailystocktopick.com/public_html/index.php on line 141
Warning: DOMDocument::loadHTML(): Unexpected end tag : a in Entity, line: 237 in /home/u552734802/domains/dailystocktopick.com/public_html/index.php on line 141
Warning: DOMDocument::loadHTML(): Unexpected end tag : a in Entity, line: 237 in /home/u552734802/domains/dailystocktopick.com/public_html/index.php on line 141
Warning: DOMDocument::loadHTML(): Unexpected end tag : a in Entity, line: 237 in /home/u552734802/domains/dailystocktopick.com/public_html/index.php on line 141
Warning: DOMDocument::loadHTML(): Unexpected end tag : a in Entity, line: 237 in /home/u552734802/domains/dailystocktopick.com/public_html/index.php on line 141
Warning: DOMDocument::loadHTML(): Unexpected end tag : a in Entity, line: 237 in /home/u552734802/domains/dailystocktopick.com/public_html/index.php on line 141
Warning: DOMDocument::loadHTML(): Unexpected end tag : a in Entity, line: 237 in /home/u552734802/domains/dailystocktopick.com/public_html/index.php on line 141
Warning: DOMDocument::loadHTML(): Unexpected end tag : a in Entity, line: 237 in /home/u552734802/domains/dailystocktopick.com/public_html/index.php on line 141
Warning: DOMDocument::loadHTML(): Unexpected end tag : a in Entity, line: 237 in /home/u552734802/domains/dailystocktopick.com/public_html/index.php on line 141
Warning: DOMDocument::loadHTML(): Unexpected end tag : a in Entity, line: 237 in /home/u552734802/domains/dailystocktopick.com/public_html/index.php on line 141
Warning: DOMDocument::loadHTML(): Unexpected end tag : a in Entity, line: 237 in /home/u552734802/domains/dailystocktopick.com/public_html/index.php on line 141
Warning: DOMDocument::loadHTML(): Unexpected end tag : a in Entity, line: 237 in /home/u552734802/domains/dailystocktopick.com/public_html/index.php on line 141
Warning: DOMDocument::loadHTML(): Unexpected end tag : a in Entity, line: 237 in /home/u552734802/domains/dailystocktopick.com/public_html/index.php on line 141
Warning: DOMDocument::loadHTML(): Unexpected end tag : div in Entity, line: 237 in /home/u552734802/domains/dailystocktopick.com/public_html/index.php on line 141
Warning: DOMDocument::loadHTML(): Unexpected end tag : li in Entity, line: 237 in /home/u552734802/domains/dailystocktopick.com/public_html/index.php on line 141
Warning: DOMDocument::loadHTML(): Unexpected end tag : ul in Entity, line: 237 in /home/u552734802/domains/dailystocktopick.com/public_html/index.php on line 141
Warning: DOMDocument::loadHTML(): Unexpected end tag : h2 in Entity, line: 252 in /home/u552734802/domains/dailystocktopick.com/public_html/index.php on line 141
Warning: DOMDocument::loadHTML(): Unexpected end tag : p in Entity, line: 253 in /home/u552734802/domains/dailystocktopick.com/public_html/index.php on line 141
Warning: DOMDocument::loadHTML(): Unexpected end tag : button in Entity, line: 256 in /home/u552734802/domains/dailystocktopick.com/public_html/index.php on line 141
Warning: DOMDocument::loadHTML(): Unexpected end tag : div in Entity, line: 257 in /home/u552734802/domains/dailystocktopick.com/public_html/index.php on line 141
| Ameriprise Financial Inc | |||
| Symbol: | AMP | Current: | 545.84 |
| Breakout: | 549.44 | Target: | 572.83 |
| Support: | 544.08 | Resist: | 0.00 |
| Volume: | 480.8k shares -27.6% compared to typical volume of 664.2k | ||
|
|
|||